影响太阳能电池板效率的5大因素

导言

Why does a solar panel rated at 550 W often produce less power in actual operation? This is a common concern for PV system owners and O&M teams, especially when measured output is consistently below the expected level. Lower generation does not necessarily indicate a faulty module. Changes in 太阳辐照度, module temperature, shading, soiling, and electrical system conditions can all reduce the power delivered by a PV system.

The rated power and efficiency of a solar panel are measured under standardized test conditions, while operating conditions in the field vary throughout the day and across seasons. As a result, evaluating solar panel efficiency loss requires more than looking at the module’s rated output. PV operators need to compare actual power generation with key operating conditions to determine whether a lower output is caused by weather and solar resource changes or by a measurable system performance loss.

Understanding these Solar Efficiency Loss Factors is important for both performance evaluation and maintenance planning. Solar irradiance, module temperature, shading, soiling, and module or system-level losses are among the main factors that should be considered when analyzing real-world PV performance. This article explains how these factors affect solar panel output, what data can be used to identify the source of the loss, and how practical monitoring can support more accurate PV performance analysis and maintenance decisions.

What Causes Solar Panel Efficiency Loss?

The main solar efficiency loss factors affecting PV systems include solar irradiance, module temperature, shading, soiling, and module or system-level losses. These factors do not affect every project in the same way, and their impact depends on site conditions, module technology, system design, and operating conditions. Understanding which variables need to be monitored provides a practical starting point for identifying the causes of lower-than-expected PV output.If you want to learn how to increase solar farm output using environmental sensors, ,请点击该文章。.

Solar Efficiency Loss FactorMain ImpactTypical Monitoring Method
太阳辐射通量Changes in available solar energyPyranometer / Solar Irradiance Sensor
模块温度Changes in module operating performanceBack-of-Module Temperature Sensor
ShadingReduction in effective irradianceSite Inspection / Irradiance Comparison
SoilingReduced light reaching the cellsSoiling Monitor / Performance Comparison
Module & System LossesDifferences between expected and actual energy outputInverter / Power / PV Performance Monitoring

Top 5 Solar Efficiency Loss Factors

A solar panel may have a high rated power, but its actual output can change from day to day. A cloudy morning, high module temperature, partial shading, dust on the surface, or an electrical issue can all reduce the energy produced by a PV system. The important question is not simply how much power is being lost, but what is causing the loss and whether it can be measured and managed. Below are five common factors that can affect solar panel performance in real-world operation.

Solar Irradiance and Weather Conditions

Solar irradiance determines how much solar energy is available to the PV array. Clouds, weather, time of day, and seasonal changes can all affect the available radiation, so lower PV output does not always mean a problem with the panels. To understand the reason for a drop in generation, irradiance data needs to be considered alongside actual power output.

PV projects may use different irradiance measurements for different purposes. GHI (Global Horizontal Irradiance), POA (Plane-of-Array Irradiance), DNI (Direct Normal Irradiance), and DHI (Diffuse Horizontal Irradiance) describe different components or measurement planes of solar radiation. For PV performance analysis, POA is particularly useful because it reflects the radiation received by the modules at their installed orientation. For a detailed explanation, see 太阳能中的GHI、DNI和DHI是什么?.

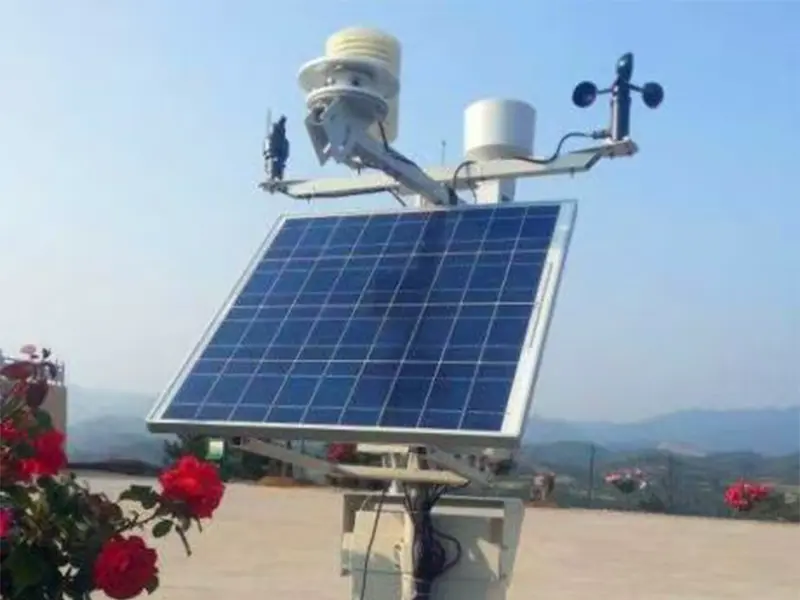
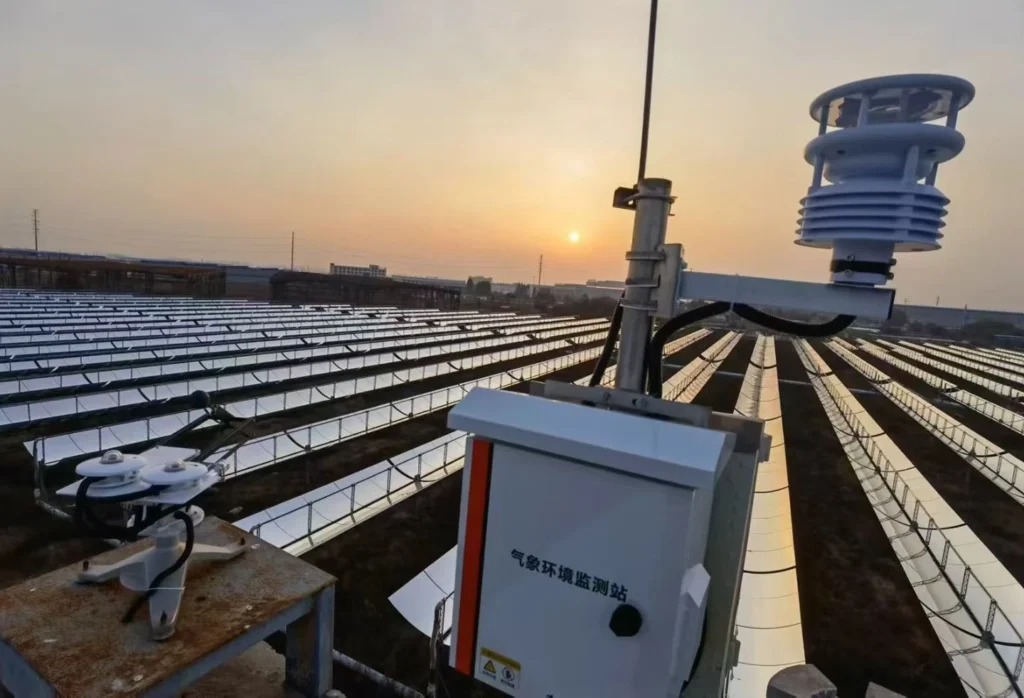
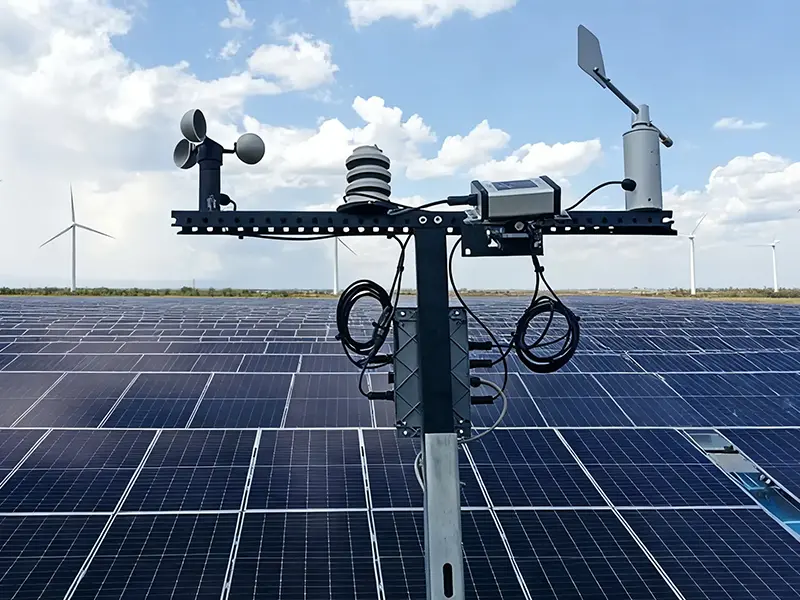
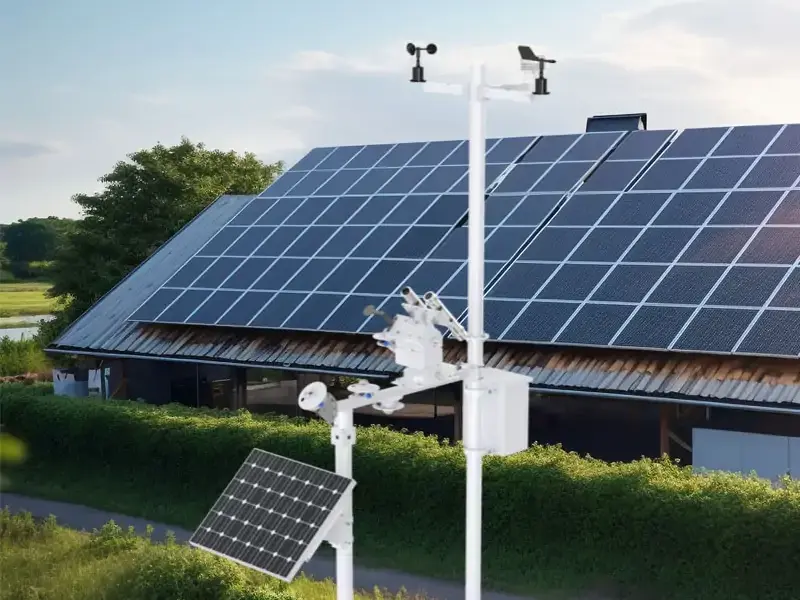
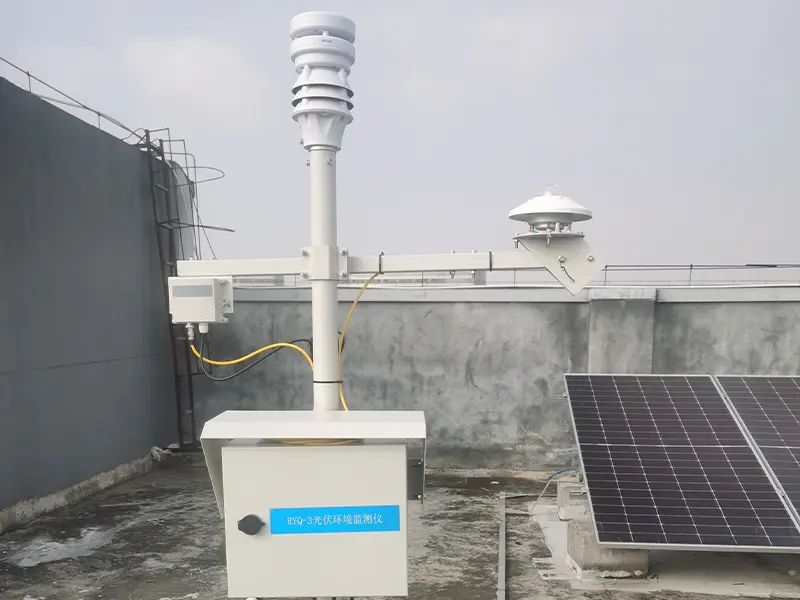
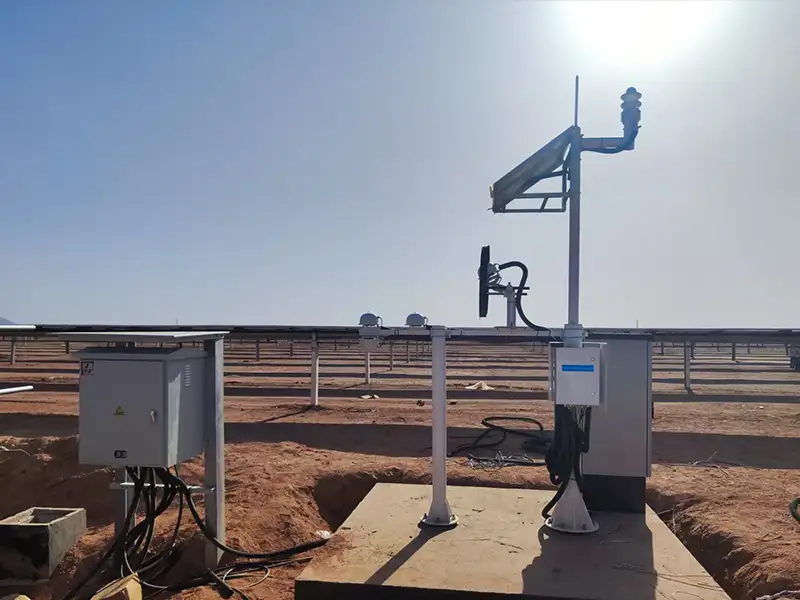
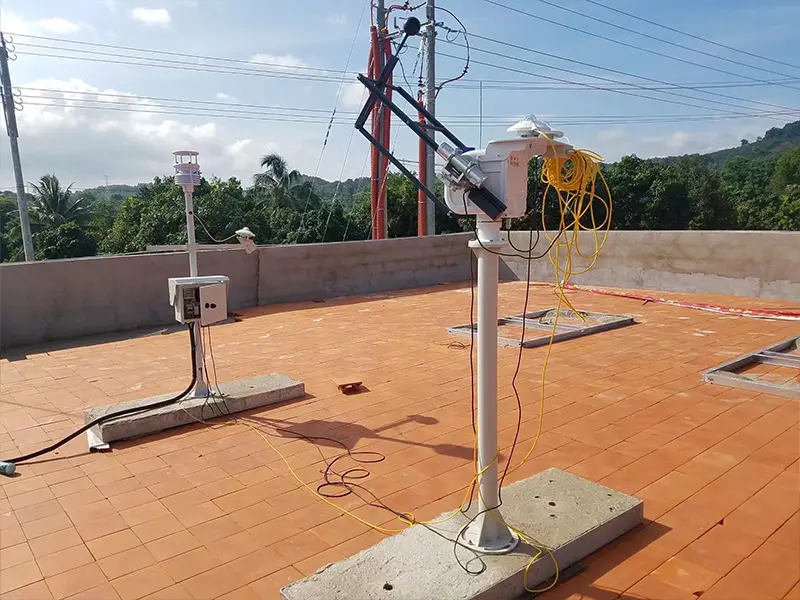
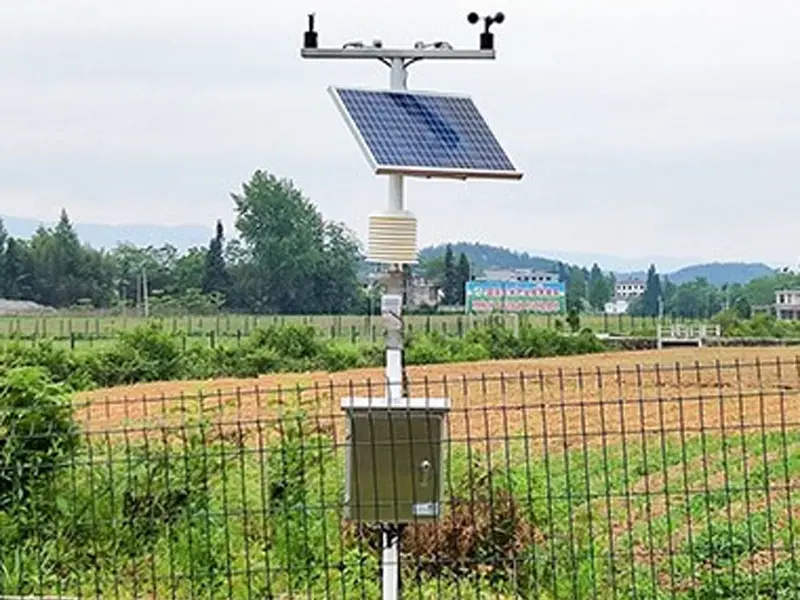
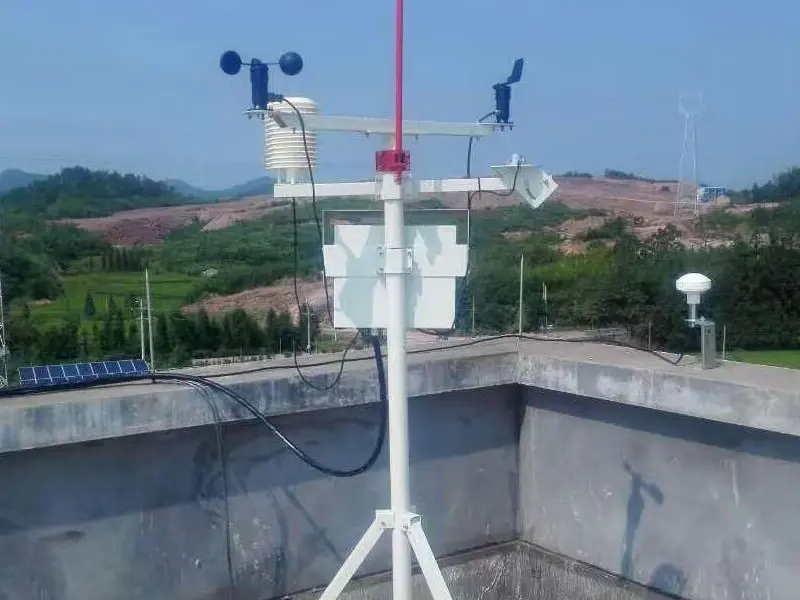
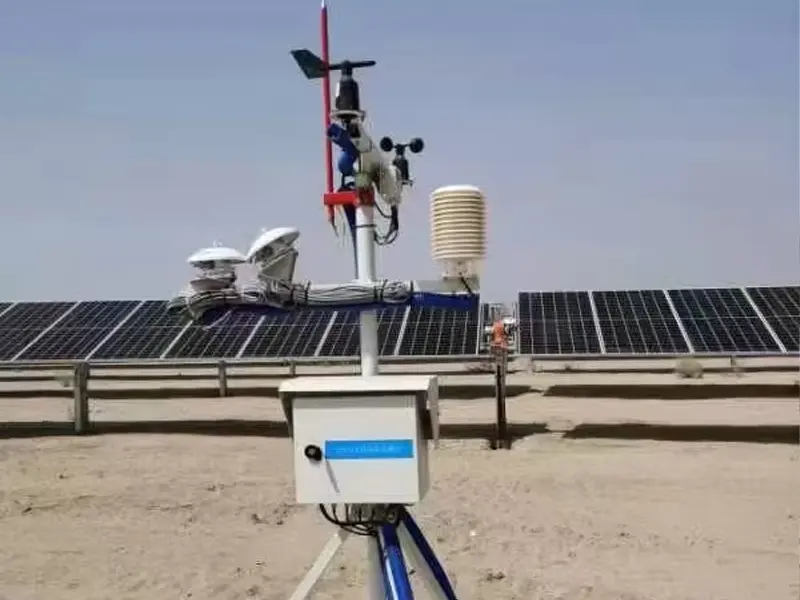
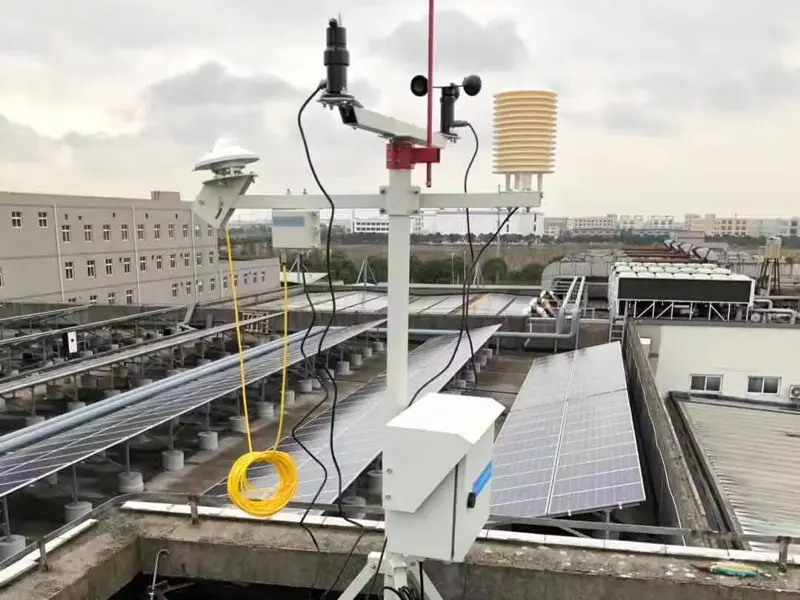
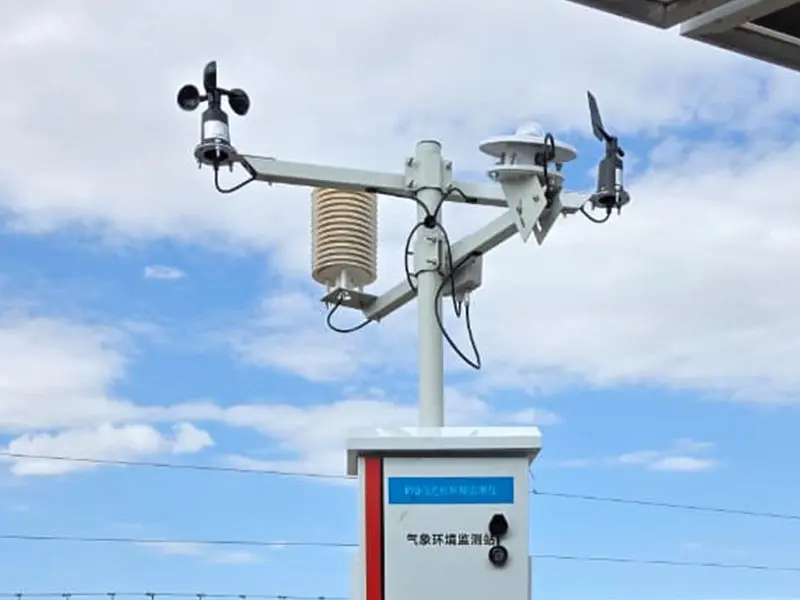
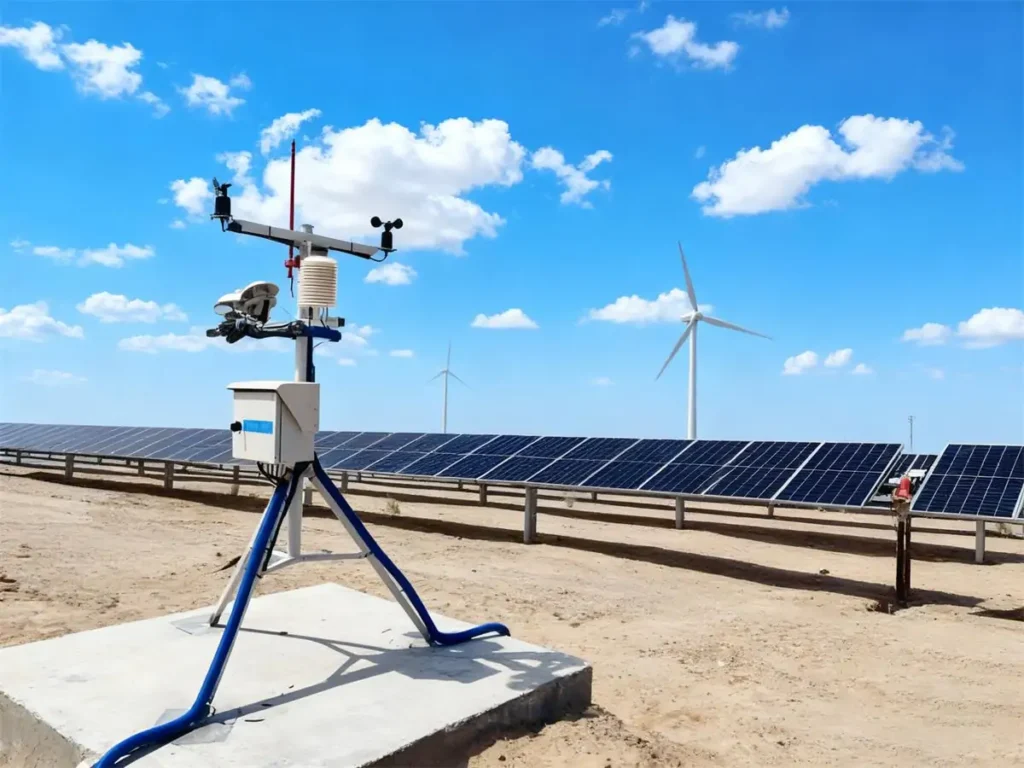
For day-to-day performance monitoring, the main data may include solar irradiance, ambient temperature, module temperature, wind speed and direction, and relative humidity. A solar irradiance sensor, pyranometer, or compact weather station can provide this information, allowing operators to compare solar conditions with PV output and determine whether lower generation is related to weather or system performance.

High Module Temperature

Solar panels can get much hotter than the surrounding air when they are exposed to strong sunlight. As the cell temperature rises, the electrical characteristics of the module change and its power output generally decreases. The exact effect depends on the module’s power temperature coefficient, which can be found in the manufacturer’s datasheet. As a simple reference, the temperature-related power change can be estimated as:

Temperature-related power change ≈ Temperature Coefficient × (Cell Temperature − 25°C)

The important point is that ambient temperature is not the same as module temperature. A panel exposed to strong irradiance can become significantly warmer than the air around it, while wind, mounting structure, and airflow behind the module can change how quickly it heats up or cools down. This is why ambient weather data alone may not be enough when investigating temperature-related solar panel efficiency loss.

A module temperature sensor installed on the back of the panel provides a more direct measurement of its operating condition. When module temperature is compared with solar irradiance and PV power output, O&M teams can better identify whether a reduction in generation is related to high operating temperature or another factor. For larger PV projects, this data can also be combined with a solar weather stationPV performance monitoring system.

Shading and Uneven Solar Exposure

Shading is a common cause of lower solar panel performance, especially when a PV system is installed near trees, buildings, structures, or other obstacles. The effect can change throughout the day as the sun moves, so a panel that performs normally in the morning may experience shading later in the day. In larger plants, row-to-row spacing and the arrangement of the PV array can also affect how much sunlight reaches each module.

Common sources of shading include:

  • Tree and building shading
  • Row-to-row and self-shading
  • Poles, cables, and mounting structures
  • Partial shading on individual modules

Partial shading needs particular attention because the loss in array output is not always proportional to the shaded area. A small shaded section can affect the output of a module or string depending on its electrical configuration, bypass diodes, string design, and inverter MPPT operation. This means that simply estimating the shaded area may not accurately show the resulting energy loss.

To investigate solar shading losses, operators can compare solar radiation with PV output and check how production changes at different times of day. A radiation sensor installed near the PV array can provide continuous data on available solar radiation, making it easier to compare changing sunlight conditions with module, string, or inverter output. Thermal inspection can also help identify abnormal modules, while string and MPPT data can help locate recurring shading problems.

Dust, Soiling, and Surface Contamination

Solar panel soiling is a common cause of lower PV output. Dust, sand, pollen, bird droppings, industrial particles, agricultural residues, and salt deposits can build up on module surfaces and reduce the amount of sunlight reaching the cells. The impact can be more noticeable in dry, dusty, coastal, agricultural, or industrial environments.

Soiling is not only about reduced light transmission. Uneven deposits can create non-uniform shading across a module and may also affect its thermal condition. The actual impact depends on the type and distribution of the material, rainfall, wind, humidity, module tilt, and local site conditions, so the same level of soiling does not necessarily cause the same energy loss at every PV site.

How Do You Know When Solar Panels Need Cleaning?

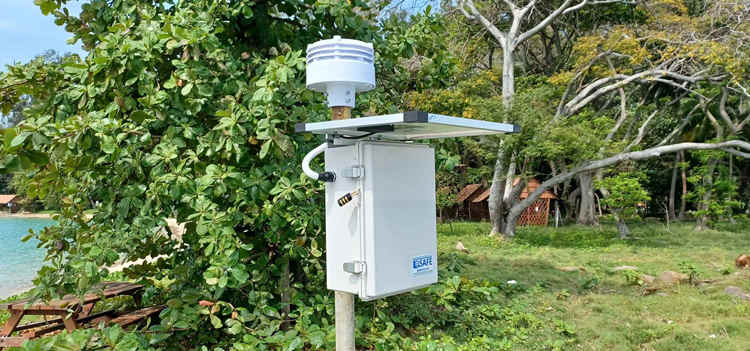
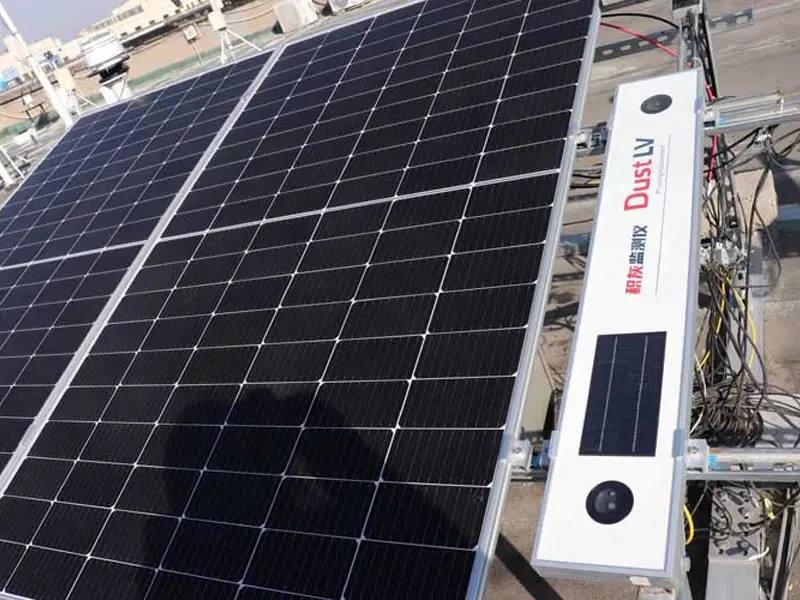
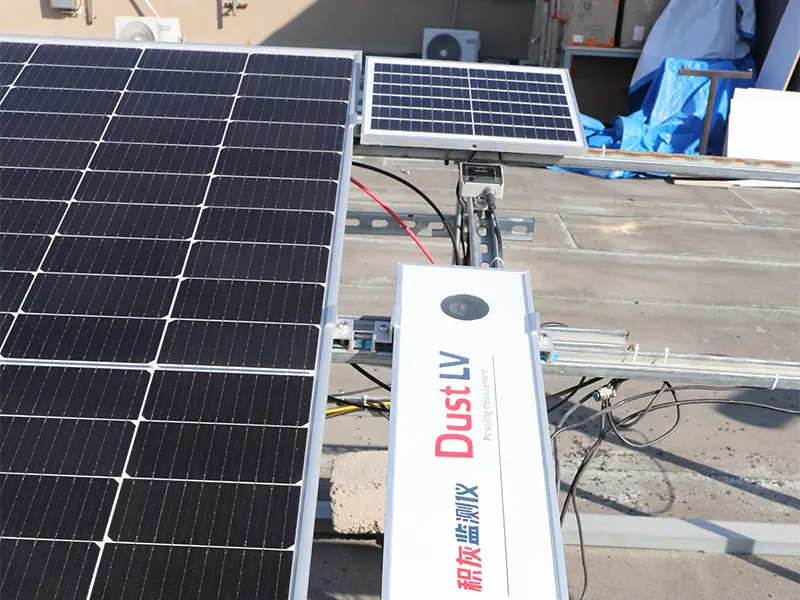
A fixed cleaning schedule is not always the most economical approach. Cleaning frequency should be based on the soiling rate, local weather, dust characteristics, measured performance, and cleaning costs. DustLV光伏组件污染状态监测仪 can be used to monitor the pollution condition of PV modules, helping O&M teams understand how surface contamination is changing over time.

For projects that need a broader assessment of dust conditions, the DustCom Photovoltaic Dust Index Monitoring System can provide dust-related monitoring data for evaluating the site’s pollution level and its potential impact on PV operation. Using DustLV for module surface pollution monitoring and DustCom for dust index monitoring gives operators additional data for planning cleaning and evaluating soiling-related performance losses.

For utility-scale PV plants, these measurements can be combined with solar radiation, module temperature, and PV output data to better understand the actual impact of soiling. This helps operators decide when cleaning is worthwhile instead of relying only on a fixed calendar schedule.

Module, Electrical, and System-Level Performance Losses

Not all PV output losses come from weather or surface conditions. Module degradation, mismatch, wiring losses, inverter performance, and electrical faults can also reduce the energy produced by a solar system. Issues such as microcracks, PID, connector problems, or DC cable losses may develop gradually and are not always visible during a basic site inspection.

A module may appear to be working normally while the overall PV system still produces less energy than expected. Comparing PV output with solar radiation, module temperature, inverter data, and electrical measurements can help O&M teams determine whether the loss comes from the modules or other parts of the system.

How to Measure Solar Efficiency Loss in the Field?

When a PV system produces less power than expected, looking at the power output alone does not always show the reason. Lower generation may be caused by reduced sunlight, high module temperature, soiling, shading, or a problem within the electrical system.

A practical field assessment starts by measuring the available solar radiation and comparing it with actual PV generation. Other operating data, such as module temperature and weather conditions, can then help determine whether the change is caused by the environment or by the PV system itself.

Measure Solar Irradiance as the Reference

Solar irradiance is one of the most important reference values when evaluating PV performance. The amount of sunlight reaching the array changes throughout the day and with weather conditions, so actual power generation needs to be considered together with the available solar radiation.

Different applications may use different radiation measurements. A pyranometer measures solar radiation, while a POA irradiance sensor measures the radiation received by the PV modules at their installed angle. GHI and DNI measurements can also be used for specific solar resource monitoring requirements.

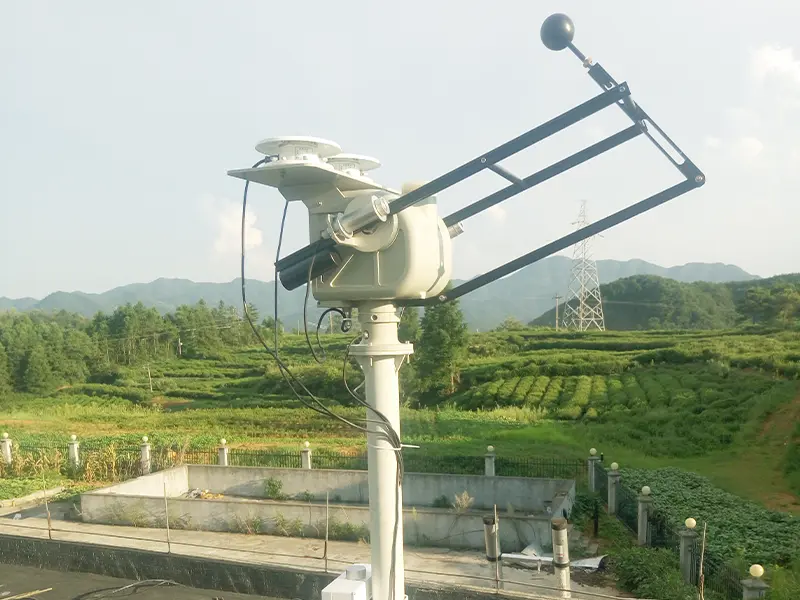
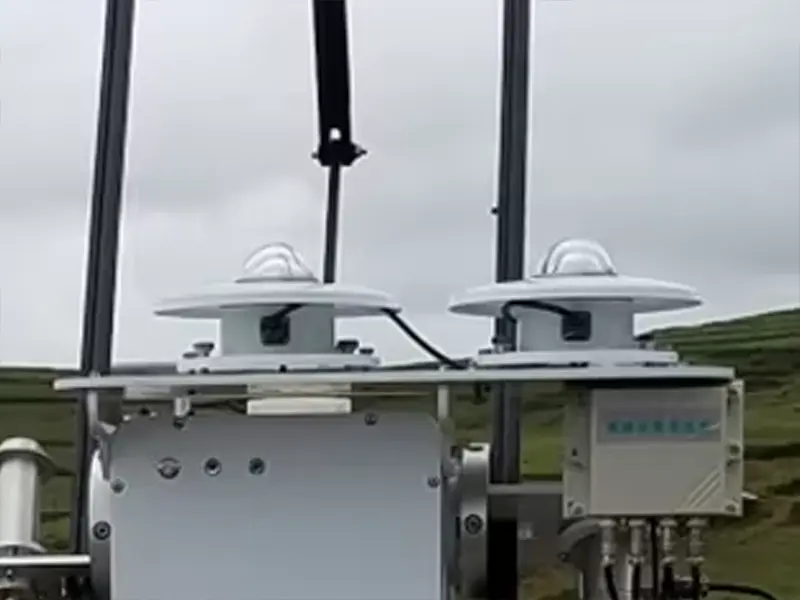
For continuous solar radiation monitoring, the TBQ-2C Pyranometer provides a practical way to collect irradiance data for PV performance assessment. The SR30 Solar Radiation Sensor can be used for projects requiring a more advanced solar radiation measurement solution.

With reliable irradiance data, operators have a reference for determining whether a change in PV output is simply related to changing sunlight or requires further investigation.

Compare Irradiance with PV Output

Irradiance data becomes more useful when it is compared with actual PV generation. If solar radiation decreases and PV output changes accordingly, the lower generation may be related to weather conditions. If radiation remains relatively stable while output is consistently lower than expected, the system may need further inspection.

Module temperature, soiling conditions, shading, inverter data, and other operating information can provide additional context when investigating a performance drop. By tracking these data over time, O&M teams can compare expected and actual output, identify recurring loss patterns, and determine when inspection or maintenance is needed.

Solar Efficiency Loss Factors vs. What You Can Control

Not every solar efficiency loss can be eliminated. Some losses are caused by changing solar resources and natural conditions, while others can be reduced through better system design, regular maintenance, and timely monitoring. For PV projects, the practical goal is to identify which losses can be controlled, understand their impact on generation, and focus maintenance efforts where they can provide the greatest value.

Solar Efficiency Loss FactorControl LevelMain Action
太阳辐射通量Not controllableAccurate solar resource assessment and monitoring
模块温度Partly controllableSuitable module selection and ventilation
ShadingControllableSite design, array layout, and vegetation control
SoilingControllableCleaning strategy and soiling monitoring
Electrical & System LossesControllableProper system design, inspection, and maintenance
Module DegradationPartly controllableQuality module selection and regular performance inspection

How to Diagnose a Drop in Solar PV Output?

When solar PV output drops, the first question is whether the change is caused by lower solar resources or an actual system problem. A practical diagnosis starts with operating data and then moves from environmental conditions to visible issues and electrical components. This helps avoid treating normal weather-related changes as equipment faults.

Step 1: Check Solar Irradiance

Start by checking the solar irradiance during the period when PV output decreased. If irradiance also dropped because of clouds, haze, or other weather conditions, lower generation may be expected. If irradiance remains relatively stable while PV output is noticeably lower, further investigation is needed.

Step 2: Check Module Temperature

If irradiance is normal, check the module operating temperature. High module temperatures can reduce PV power output, especially during periods of strong sunlight. Comparing module temperature with irradiance and historical operating data can help determine whether temperature is contributing to the lower output.

Step 3: Check Soiling and Shading

If irradiance and temperature do not explain the change, check the modules for dust, bird droppings, vegetation, nearby structures, or other shading sources. Pay attention to changes at specific times of day or in specific array sections, as partial shading may only affect production during certain periods.

Step 4: Check the Electrical System

If environmental conditions appear normal, inspect the electrical side of the system. Inverter status, string output, connectors, cables, and module condition should be checked for abnormal readings or faults. A problem limited to one string, MPPT, or inverter can often be identified by comparing its output with other operating sections.

Simple Diagnostic Logic

PV Operating ConditionRecommended Diagnostic Focus
Low irradianceCheck weather conditions and available solar radiation
Normal irradiance + high module temperatureCheck temperature-related performance loss
Normal irradiance + normal temperature + visible contaminationCheck module soiling and surface condition
Normal conditions + time-specific or area-specific output lossCheck for shading from trees, structures, or array layout
Normal conditions + persistent low outputCheck the inverter, strings, cables, connectors, and modules

For long-term operation, continuous PV performance monitoring makes this process easier. By keeping irradiance, temperature, weather, and generation data together, operators can identify abnormal changes earlier and decide when a site inspection or maintenance action is necessary.

结论

Solar PV performance cannot be evaluated from power output alone. The same PV system can produce different amounts of electricity under different irradiance, temperature, weather, and surface conditions. When actual output is assessed together with these operating conditions, it becomes easier to determine whether a reduction is caused by normal changes in the solar resource or by a performance issue within the system.

A useful approach is Measure → Compare → Identify → Quantify → Correct. Solar irradiance and other operating data provide the reference for comparison with actual generation. When the measured conditions and power output do not match the expected operating pattern, further analysis can be used to locate the cause and determine whether corrective action is worthwhile.

For long-term PV operation, this is where monitoring becomes valuable. Reliable measurement data gives O&M teams a consistent basis for evaluating performance, tracking changes over time, and making maintenance decisions based on actual site conditions rather than output data alone.

Need to identify the causes of PV efficiency loss? Explore our solar radiation, weather, module temperature, and soiling monitoring solutions, or 请联系我们的技术团队 to discuss the monitoring needs of your PV project.

常见问题

太阳能电池板效率损失可能由太阳辐照度降低、组件温度过高、遮挡、表面污垢、组件老化和电气损耗引起。这些因素对每个光伏系统的影响并不相同。现场条件、组件类型、阵列设计和运行条件都会影响实际影响程度。测量相关运行数据有助于确定哪个因素对发电量降低的贡献最大。.

太阳能电池板的额定功率是在标准测试条件下测得的,而现场条件不断变化。实际输出取决于太阳辐照度、组件温度、遮挡、污垢以及系统运行条件。因此,550 W组件在正常运行中不会持续输出550 W。其性能应根据发电时的条件进行评估。.

将光伏输出与同期测量的太阳辐照度进行比较。如果辐照度因云层、雾霾或天气变化而下降,且输出随之变化,则发电量减少可能属于正常现象。如果辐照度保持相对稳定而光伏输出下降,则应进一步排查系统。此时,组件温度、污垢、遮挡、逆变器数据及组串性能可帮助缩小原因范围。.

灰尘、沙粒、花粉、鸟粪及其他沉积物会减少到达光伏电池的太阳光量。不均匀的污垢还可能在组件上造成局部遮挡。由此产生的性能损失取决于污染物的类型和数量、降雨、风、湿度、组件倾角及当地条件。污垢监测仪可帮助根据实际现场条件判断清洁是否合理。.

是的。光伏组件功率通常会随着电池温度升高而下降,超过其额定功率所依据的参考条件。实际温度效应取决于组件的功率温度系数,该系数由制造商规定。将组件温度与太阳辐照度和光伏输出一起测量,可为判断高温运行是否导致发电量减少提供更可靠的依据。.

一套实用的光伏监测系统通常包括太阳辐照度、组件温度、环境气象条件以及光伏发电功率输出。在积尘显著的区域,污垢信息同样具有参考价值。这些测量数据使运维人员能够将环境条件与实际发电量进行对比,从而识别性能变化。所需传感器及监测配置应根据项目规模、地理位置和分析需求进行选择。.

没有一种清洁间隔适用于所有光伏电站。清洁频率取决于当地灰尘状况、降雨量、污染速率、组件朝向以及清洁成本。监测污垢状况并将其与光伏性能进行对比,可以显示污染何时对发电产生显著影响。这使得运维团队能够根据实测条件而非固定日历安排清洁计划。.

所需传感器取决于所研究的性能问题。太阳辐照度传感器或总辐射表提供辐射参考,而组件温度传感器测量面板运行条件。气象传感器可补充环境条件,污秽监测器可跟踪表面污染情况。这些测量可与光伏发电量和逆变器数据集成,以更全面地了解系统性能。.

相关文章