Introducción
En la industria solar multimegavatio, el polvo y los residuos ambientales representan un impuesto silencioso sobre el rendimiento de los activos, por lo que la supervisión de las pérdidas por suciedad de los módulos fotovoltaicos es una estrategia indispensable para las operaciones de las plantas modernas. Sin datos granulares y en tiempo real sobre cómo la acumulación de suciedad degrada conjuntos específicos, los gestores de activos corren el riesgo de perder millones en energía no capturada o de gastar más de la cuenta en programas de limpieza prematuros.
La implantación de un sólido sistema de supervisión de la pérdida de suciedad de los módulos fotovoltaicos acorta la distancia entre las conjeturas y la precisión en la operación y el mantenimiento. Al calcular continuamente el índice de ensuciamiento (SR) exacto, esta tecnología permite a los operadores realizar la transición a una limpieza basada en las condiciones, maximizando la producción de energía y protegiendo el ROI a largo plazo de las inversiones solares a escala comercial.
Entender la suciedad de los módulos fotovoltaicos y su impacto financiero
¿Qué es la pérdida de suciedad fotovoltaica?
Las pérdidas por suciedad en los sistemas fotovoltaicos se refieren al fenómeno en el que contaminantes como el polvo, la arena, los excrementos de pájaros, los depósitos de sal y el polen se acumulan en la superficie de los módulos fotovoltaicos, bloqueando la luz solar y reduciendo la transmitancia de la luz, lo que provoca una disminución de la eficiencia de generación de energía y una reducción de la producción de electricidad.
Pérdida de suciedad fotovoltaica se refiere a la disminución de la producción de energía eléctrica causada por la acumulación de materia sólida en la superficie de los módulos fotovoltaicos. Esta capa acumulada actúa como una barrera física, absorbiendo y dispersando la luz solar entrante antes de que pueda llegar a las células solares situadas debajo.
Cómo el polvo, el polen y los excrementos de pájaros degradan la eficiencia solar
Diferentes tipos de partículas degradan la eficiencia solar a través de mecanismos físicos y químicos distintos. Comprender estos contaminantes es esencial para diseñar estrategias de mitigación eficaces:
- Polvo atmosférico y partículas del suelo: Las partículas finas suspendidas en el aire se asientan uniformemente con el tiempo. Mientras que una fina capa de polvo ligero causa una degradación lineal y predecible, una acumulación más pesada puede crear una costra densa, especialmente cuando se combina con rocío nocturno o lluvia ligera que cementa las partículas al vidrio.
- Polen y residuos agrícolas: El polen es muy pegajoso y orgánico. Se adhiere firmemente al revestimiento antirreflectante (ARC) del vidrio fotovoltaico, resistiendo la limpieza natural por el viento. Con el tiempo, puede favorecer el crecimiento orgánico localizado (como hongos o algas) en entornos húmedos.
- Excrementos de aves (puntos críticos de suciedad): A diferencia del polvo uniforme, los excrementos de pájaros crean un fuerte sombreado localizado. Esto provoca una drástica caída localizada de la corriente. Dado que las células solares de un módulo están conectadas en serie, una sola célula muy sombreada puede obligar a toda la cadena a puentearla, provocando caídas de potencia desproporcionadas y creando puntos calientes térmicos que dañan permanentemente el encapsulado del módulo.
El coste oculto: Millones perdidos en todo el mundo por la suciedad no controlada
Las consecuencias financieras de la suciedad no controlada son graves, lo que hace que pase de ser un problema menor de mantenimiento a un riesgo financiero crítico para los gestores de activos solares.
1. El creciente déficit de ingresos
En las regiones áridas o muy contaminadas (como Oriente Medio, el norte de África, partes de la India o el suroeste de EE.UU.), los paneles solares que no se limpian pueden llegar a ensuciarse a diario a un ritmo superior a 2.000 toneladas. De 0,5% a más de 1,0%. En sólo unas semanas, sin lluvia ni intervención manual, una central eléctrica puede perder fácilmente 15% a 30% de su capacidad de generación. Para una central de 100 MWp, una pérdida sostenida de suciedad no controlada de 10% puede traducirse directamente en más de $1 millones de pérdida de ingresos anuales.
2. El “punto ciego” del coeficiente de rendimiento (RP)
Sin una supervisión específica de la suciedad, los operarios no pueden distinguir con precisión entre una planta cuyo rendimiento es insuficiente debido a la degradación del equipo (por ejemplo, fallos del inversor, PID) y otra que simplemente está sucia. Esta falta de visibilidad conduce a un diagnóstico erróneo de los problemas de rendimiento y a una resolución de problemas ineficaz.
3. Horarios de limpieza subóptimos
Las plantas no supervisadas suelen confiar en una limpieza fija basada en el calendario (por ejemplo, limpieza cada 3 meses). Este enfoque introduce dos ineficiencias financieras:
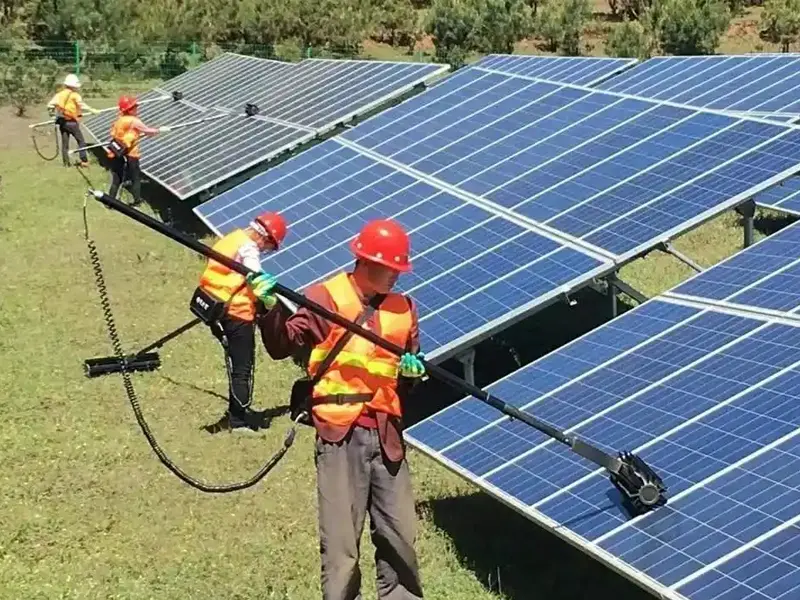
Limpiar demasiado tarde: Dejando sobre la mesa millones de dólares en energía no capturada durante los periodos de alta suciedad.
Limpiar demasiado pronto: Incurrir en enormes gastos operativos (OpEx) de agua, mano de obra o limpieza robótica cuando las ganancias reales de energía no justifican el coste.
Mediante la implantación de un control preciso de las pérdidas por ensuciamiento de los módulos fotovoltaicos, los propietarios de activos pueden pasar de un mantenimiento reactivo basado en conjeturas a un mantenimiento predictivo basado en datos, protegiendo así su retorno de la inversión.
Por qué en tiempo real Control de la suciedad es crucial para la O&M solar moderna
Más allá de la limpieza programada, el mantenimiento basado en las condiciones
Confiar en los programas de limpieza tradicionales basados en calendarios es un planteamiento anticuado que ignora la volatilidad meteorológica y los cambios ambientales localizados. Si se produce una tormenta de polvo inesperada una semana después de una limpieza programada, la planta sufrirá pérdidas masivas durante meses antes de la siguiente ronda. Por el contrario, una estación de lluvias inesperada podría limpiar los paneles gratuitamente, convirtiendo un lavado manual programado en un completo despilfarro de capital.
En tiempo real Control de las pérdidas por suciedad de los módulos fotovoltaicos cambia el paradigma a Mantenimiento basado en las condiciones (CBM). Los equipos de O&M limpian los módulos sólo cuando los datos muestran que el coste de las pérdidas acumuladas por suciedad supera el coste real de un ciclo de limpieza.
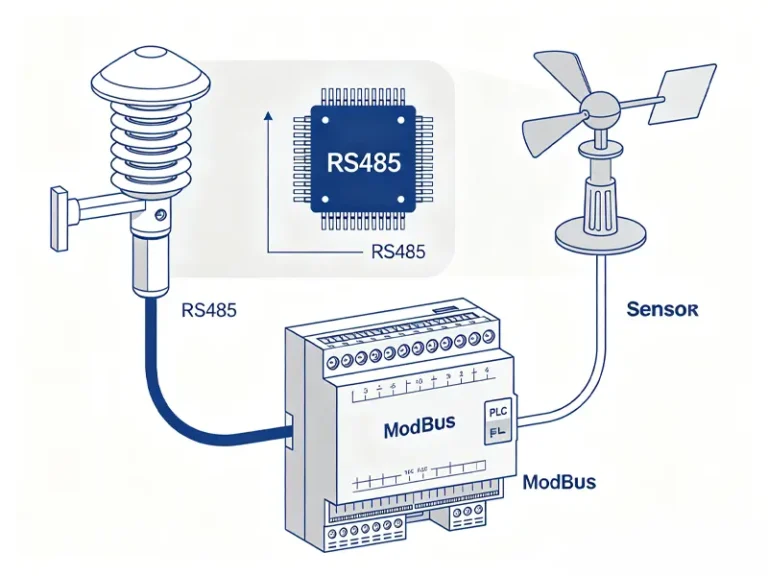
Cómo se integran los datos de suciedad con los sistemas SCADA
Los sistemas de supervisión modernos no funcionan en un silo. Al introducir las métricas del índice de ensuciamiento (SR) en tiempo real directamente en el sistema de control y adquisición de datos (SCADA) de la planta, los gestores de activos obtienen una visión agregada del estado de la planta.
[Sensores de suciedad] ──> [Modbus / RTU] ──> [SCADA de planta] ──> [Alerta automatizada de O&M]
Cuando se integran con software de gemelos digitales o plataformas avanzadas de gestión de activos, las métricas de suciedad ajustan la producción de energía de referencia prevista de la planta. Así se eliminan las falsas alarmas por bajo rendimiento y se automatiza la programación de los equipos de limpieza o los sistemas robóticos precisamente cuando tiene sentido desde el punto de vista económico.
Tecnologías clave para la medición de las pérdidas por ensuciamiento fotovoltaico
Elegir la arquitectura de medición adecuada es fundamental para la precisión de los datos y la viabilidad operativa. Hoy en día se utilizan tres enfoques tecnológicos principales:
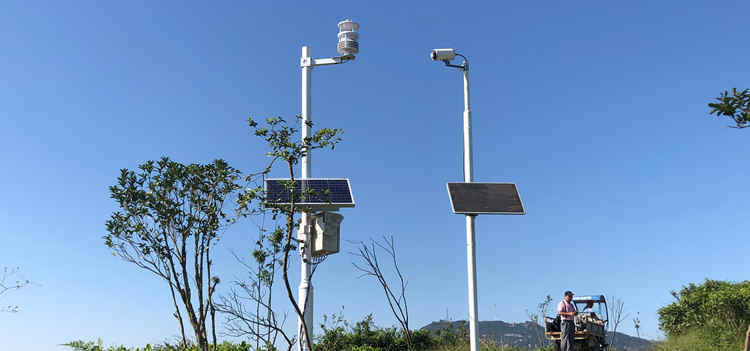
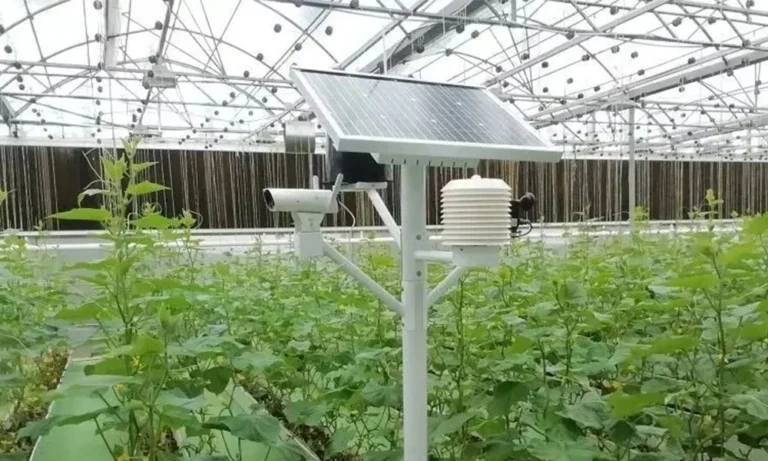
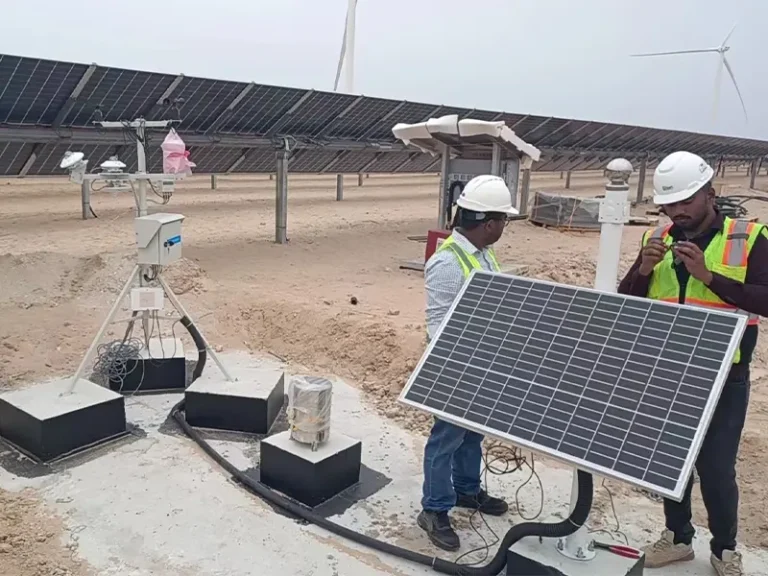
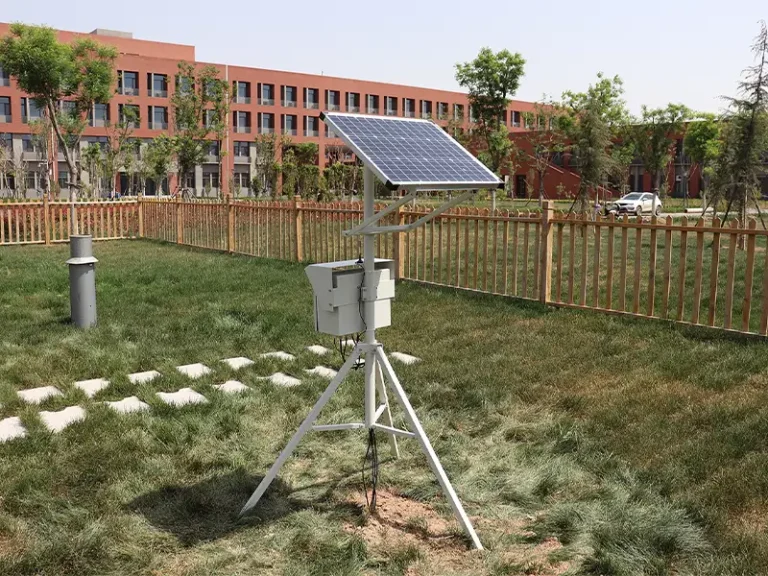
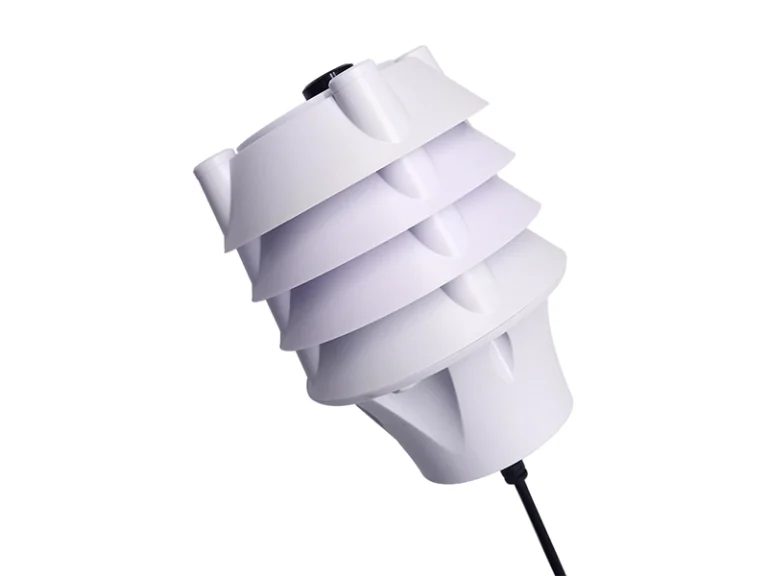
Sensores ópticos (El enfoque celular de referencia)
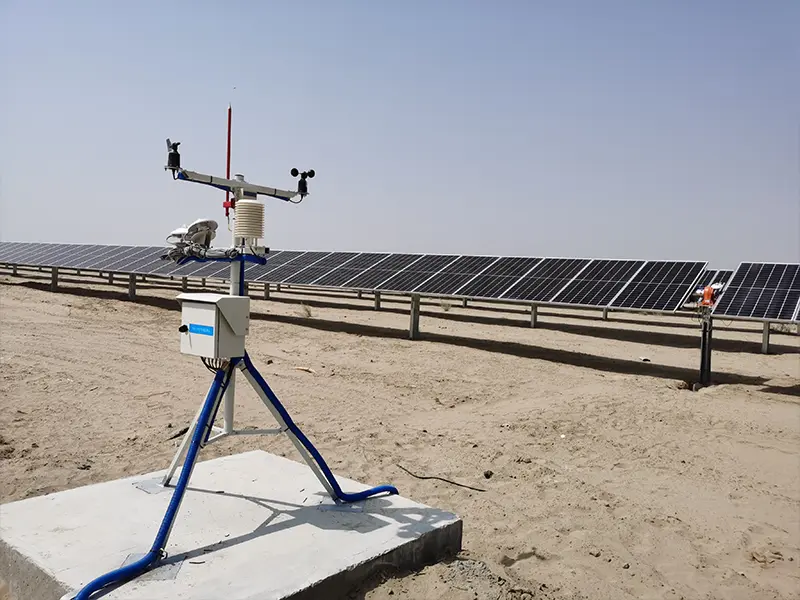
Se trata del estándar de oro para la medición física a nivel del suelo, totalmente conforme con la norma IEC 61724-1. Estos sistemas suelen utilizar dos células fotovoltaicas de referencia idénticas o pequeños módulos montados con el mismo ángulo de inclinación que el conjunto principal.
- La célula limpia: Limpieza continua mediante un limpiador mecánico automático o un mantenimiento manual regular.
- La celda sucia: Se deja expuesto a condiciones ambientales naturales.
Al comparar la corriente de cortocircuito o la potencia máxima de salida de las dos células bajo una irradiancia solar idéntica, el sistema proporciona una relación de suciedad muy precisa y en tiempo real.
Estaciones de control de la suciedad frente a sensores distribuidos
A la hora de desplegar hardware físico, los gestores de activos deben elegir entre topologías centralizadas y distribuidas:
| Característica | Estaciones de limpieza centralizadas | Sensores ópticos distribuidos |
| Arquitectura | Unas cuantas estaciones meteorológicas de gran precisión y a escala real repartidas por todo el recinto. | Decenas de pequeños nodos sensores de bajo coste se fijan directamente a los bastidores de los módulos. |
| Pros | Alta precisión; datos meteorológicos sólidos; fácil de calibrar. | Captura las variaciones microclimáticas, los patrones de polvo localizados y los errores de seguimiento específicos de los rastreadores. |
| Contras | Pasa por alto las variaciones localizadas de suciedad en emplazamientos masivos de varios kilómetros. | Mayor mantenimiento acumulado del hardware y posibles gastos generales de gestión de datos. |
IA y estimación de la suciedad por satélite: Pros y contras
Gracias a los avances en el aprendizaje automático, algunas plataformas de software ofrecen una estimación de la suciedad “sin hardware” mediante el análisis de datos meteorológicos por satélite, la profundidad óptica de los aerosoles, las predicciones de precipitaciones y las anomalías de potencia a nivel del inversor.
- Pros: Sin inversión inicial en hardware; rápida implantación en las carteras existentes.
- Contras: Las estimaciones carecen de la precisión localizada y en tiempo real necesaria para un seguimiento de alto riesgo. Las anomalías a nivel del suelo, como la anidación localizada de aves, el polvo de la construcción cercana o la labranza agrícola, no pueden modelarse con precisión desde el espacio.
Cómo calcular las pérdidas por ensuciamiento fotovoltaico (las métricas que importan)
Para aplicar una estrategia basada en datos, debe comprender cómo los valores brutos de los sensores se traducen en decisiones financieras procesables.
Entender el coeficiente de suciedad (SR) y el índice de suciedad
Mientras que el Índice de suciedad (SR) le ofrece una instantánea de la degradación actual, el Índice de suciedad indica la velocidad de acumulación.
Si una planta tiene una tasa de suciedad diaria de 0.2%, perderá aproximadamente 6% de su capacidad de generación durante un periodo seco de 30 días. Supervisión de la tarifa permite a los gestores de activos prever con exactitud cuándo la planta alcanzará umbrales críticos, con lo que el mantenimiento pasa de ser reactivo a predictivo.
Factores medioambientales: Precipitaciones, viento y topografía local
Los modelos de cálculo de la suciedad deben tener en cuenta los comportamientos ambientales localizados:
Topografía: Las partes de una planta solar situadas cerca de carreteras sin asfaltar, campos agrícolas o torres de refrigeración industriales experimentarán índices de suciedad radicalmente acelerados en comparación con las secciones más alejadas.
Elección del sistema de control de la suciedad adecuado para su proyecto
No existe una solución única; la selección de la tecnología depende en gran medida de la escala y la arquitectura de su activo solar.
                  ┌── Utility-Scale (10MW+) ──> Estaciones centralizadas + nodos distribuidos
                  │
Project Scale ────┼── C&I Rooftops ───────────> Sensores ópticos compactos / AI Software
                  │
                  └── Residencial ────────────> Estimaciones de software de IA (sin hardware)
Plantas de energía solar a escala comercial frente a tejados comerciales e industriales (C&I)
- Activos a escala de servicios públicos: Repartidos en cientos de hectáreas, estos proyectos requieren un enfoque híbrido: una estación meteorológica central equipada con sensores ópticos de alta calidad, complementada con nodos inalámbricos distribuidos para cartografiar los gradientes de suciedad en toda la propiedad.
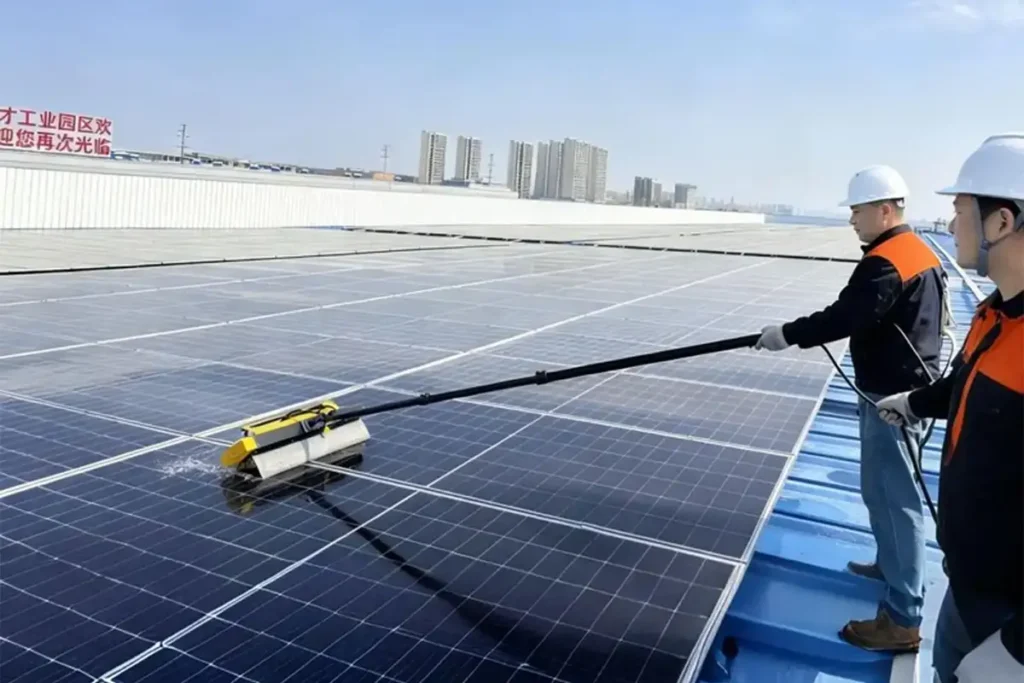
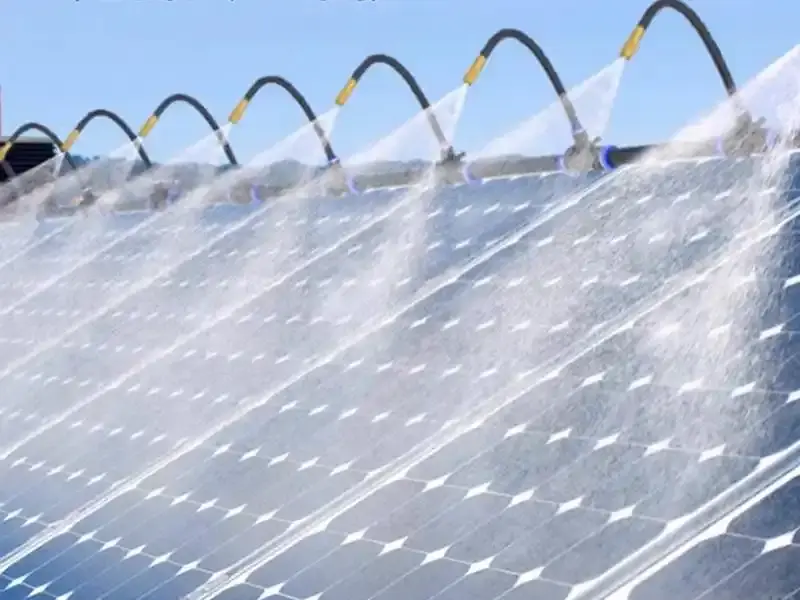
- Matrices sobre tejado para C&I: El espacio es limitado y el acceso puede ser complicado. Para las aplicaciones en tejados, los sensores ópticos compactos y de bajo mantenimiento con limpiadores autolimpiantes automáticos son ideales, ya que eliminan la necesidad de que el personal de O&M escale los tejados solo para limpiar un sensor.
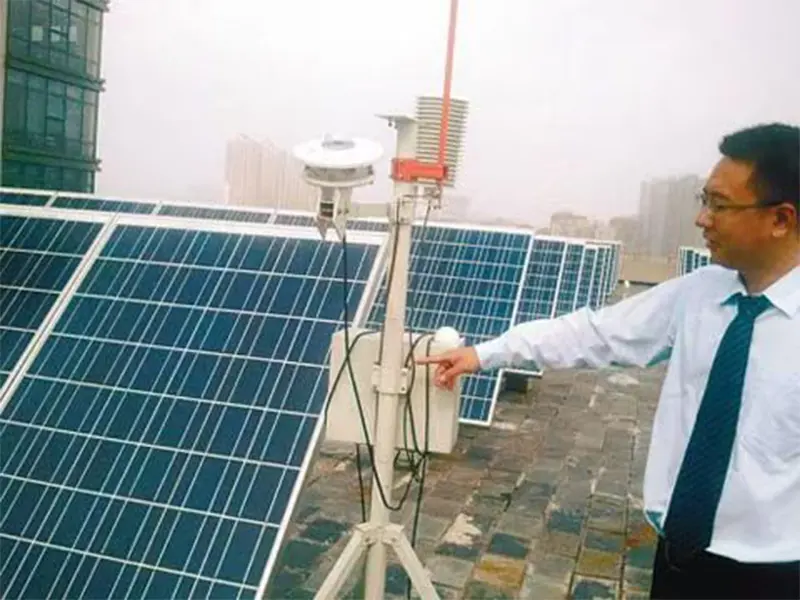
Requisitos de mantenimiento y calibración de los sensores de suciedad
La calidad de un sistema de control depende de la integridad de sus datos. Si su “célula de referencia limpia” se ensucia por culpa de un limpiaparabrisas defectuoso o de un mantenimiento manual descuidado, todo su conjunto de datos se vuelve inútil. Al evaluar el hardware, asegúrese de que su contrato de O&M tiene en cuenta:
- Validación semanal o quincenal del elemento limpio del sensor.
- Calibración anual del sensor con piranómetros trazables al NIST.
- Revestimientos antisuciedad resistentes en la propia carcasa del sensor.
Cálculo de la rentabilidad de la implantación de un sistema de control de la suciedad
Invertir en Control de las pérdidas por suciedad de los módulos fotovoltaicos hardware requiere la aprobación interna de CapEx. A continuación se explica cómo construir el caso financiero basado en métricas de gestión de activos del mundo real.
Optimizar el programa de limpieza para obtener el máximo rendimiento económico
El mejor momento financiero para la limpieza se produce cuando el coste marginal de la energía que se pierde por el polvo es igual al coste marginal de realizar una limpieza.
Veamos una comparación típica de casos empresariales:
| Métrica | Horario fijo tradicional | Basado en datos (con control de la suciedad) |
| Gatillo de limpieza | Cada 90 días (fijo) | La pérdida acumulada es superior o igual al coste de limpieza |
| Frecuencia de limpieza anual | 4 veces al año | 2 veces al año (optimizado en función de las estaciones) |
| Pérdida media anual por suciedad | 6.5% | 3.8% |
| Gasto operativo anual (coste de limpieza) | $40,000 | $20,000 |
| Valor energético recuperado | Línea de base | +$35,000 en ingresos añadidos |
Estudio de caso: Cómo la supervisión inteligente ahorró 5% en pérdidas anuales de energía
En una instalación de seguimiento de 50 MW situada en el oeste de Texas, una empresa de gestión de activos instaló una red distribuida de cinco estaciones ópticas de control de la suciedad. Históricamente, la planta limpiaba los módulos dos veces al año (primavera y otoño).
Los sensores recién instalados revelaron que el laboreo agrícola de las granjas adyacentes a mediados de verano provocó un descenso localizado y repentino de la eficiencia 8% en sólo cuatro días. Guiado por estos datos en tiempo real, el equipo autorizó una limpieza localizada de emergencia. Al romper con su rígido calendario y centrarse únicamente en los bloques afectados, la planta recuperó 5% en pérdidas anuales de generación de energía, La inversión en hardware de supervisión se amortizó completamente en los siete primeros meses.
Conclusión
En última instancia, equilibrar el máximo rendimiento energético con unos costes operativos controlados requiere ir más allá de la limpieza reactiva basada en calendarios y adoptar una supervisión precisa de la pérdida de suciedad de los módulos fotovoltaicos. Al integrar información en tiempo real basada en datos en su flujo de trabajo de O&M, eliminará los puntos ciegos de la acumulación de suciedad, se asegurará de que cada intervención de limpieza produzca un rendimiento financiero positivo y garantizará la rentabilidad a largo plazo y el valor de los activos de sus inversiones solares.
Tanto si gestiona tejados comerciales como carteras de megavatios a escala de servicios públicos, no dude en póngase en contacto con nuestro equipo técnico en cualquier momento para obtener una solución personalizada para controlar la pérdida de potencia debida a la suciedad en sus paneles solares.