Introducción
In the multi-megawatt solar industry, dust and environmental debris represent a silent tax on asset performance, making PV module soiling loss monitoring an indispensable strategy for modern plant operations. Without granular, real-time data on how dirt accumulation degrades specific arrays, asset managers risk either losing millions in uncaptured energy or overspending on premature cleaning schedules.
Implementing a robust PV module soiling loss monitoring system bridges the gap between guesswork and precision O&M. By continuously calculating the exact Soiling Ratio (SR), this technology empowers operators to transition to condition-based cleaning, maximizing power output and protecting the long-term ROI of utility-scale solar investments.
Understanding PV Module Soiling and Its Financial Impact
What is PV Soiling Loss?
Soiling loss in photovoltaic systems refers to the phenomenon in which pollutants such as dust, sand, bird droppings, salt deposits, and pollen accumulate on the surface of photovoltaic modules, blocking sunlight and reducing light transmittance, thereby leading to a decrease in power generation efficiency and a reduction in electricity output.
PV soiling loss refers to the decrease in electrical energy output caused by the accumulation of solid matter on the surface of photovoltaic modules. This accumulated layer acts as a physical barrier, absorbing and scattering incoming sunlight before it can reach the solar cells underneath.
How Dust, Pollen, and Bird Droppings Degrade Solar Efficiency
Different types of particulate matter degrade solar efficiency through distinct physical and chemical mechanisms. Understanding these contaminants is essential for designing effective mitigation strategies:
- Atmospheric Dust and Soil Particles: Fine airborne particulates settle uniformly over time. While a thin layer of light dust causes linear, predictable degradation, heavier accumulation can create a dense crust—especially when combined with night dew or light rain that cements the particles to the glass.
- Pollen and Agricultural Residue: Pollen is highly sticky and organic. It adheres firmly to the anti-reflective coating (ARC) of PV glass, resisting natural wind cleaning. Over time, it can foster localized organic growth (like fungi or algae) in humid environments.
- Bird Droppings (Soiling Hotspots): Unlike uniform dust, bird droppings create severe localized shading. This triggers a drastic localized drop in current. Because solar cells within a module are connected in series, a single heavily shaded cell can force the entire string to bypass it, causing disproportionate power drops and creating thermal hotspots that permanently damage the module encapsulation.
The Hidden Cost: Millions Lost Globally to Unmonitored Soiling
The financial consequences of unmonitored soiling are severe, moving it from a minor maintenance issue to a critical financial risk for solar asset managers.
1. The Compounding Revenue Gap
In arid or high-pollution regions (such as the Middle East, North Africa, and parts of India or the US Southwest), uncleaned solar arrays can experience daily soiling rates of 0.5% to more than 1.0%. Within just a few weeks without rain or manual intervention, a utility-scale plant can easily lose 15% to 30% of its generating capacity. For a 100 MWp plant, a sustained 10% unmonitored soiling loss can translate directly into over $1 million in lost revenue annually.
2. The “Blind Spot” in Performance Ratio (PR)
Without dedicated soiling monitoring, operators cannot accurately distinguish between a plant that is underperforming due to equipment degradation (e.g., inverter faults, PID) and one that is simply dirty. This lack of visibility leads to misdiagnosed performance issues and inefficient troubleshooting.
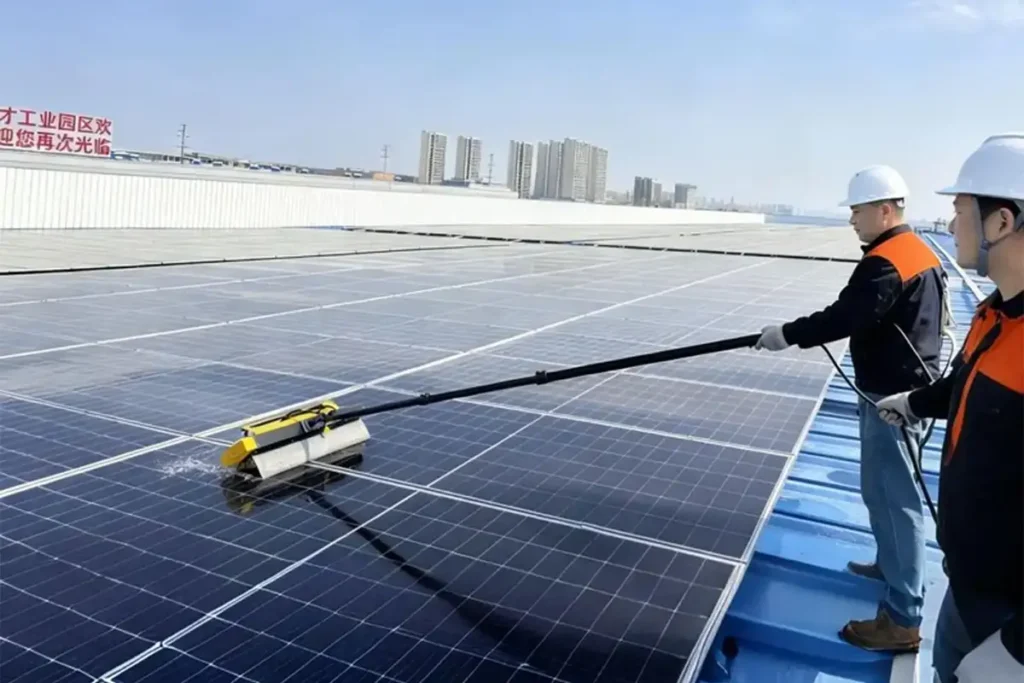
3. Sub-Optimal Cleaning Schedules
Unmonitored plants typically rely on fixed calendar-based cleaning (e.g., cleaning every 3 months). This approach introduces two financial inefficiencies:
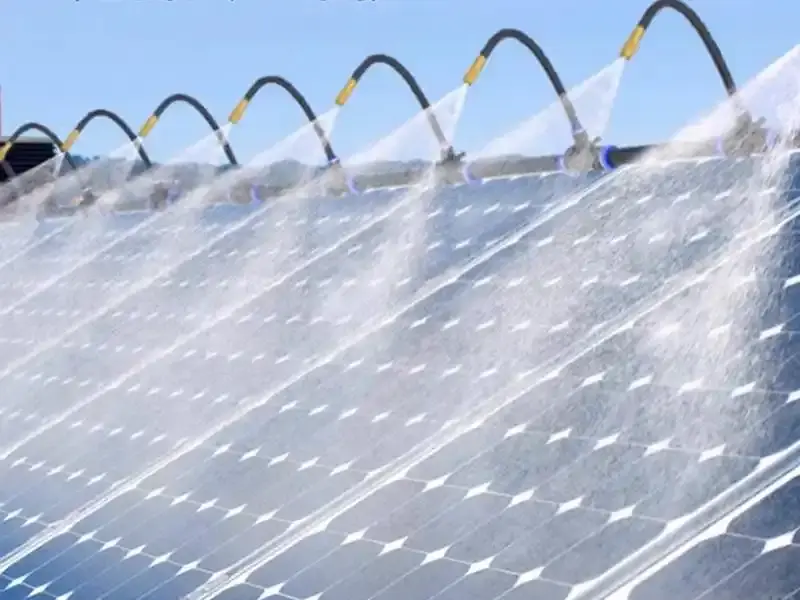
Cleaning too late: Leaving millions of dollars in uncaptured energy on the table during high-soiling periods.
Cleaning too early: Incurring massive operational expenses (OpEx) for water, labor, or robotic cleaning when the actual power gains do not justify the cost.
By deploying precise PV module soiling loss monitoring, asset owners can transition from reactive guesswork to data-driven, predictive maintenance, protecting their baseline ROI.
Why Real-Time Soiling Monitoring is Crucial for Modern Solar O&M
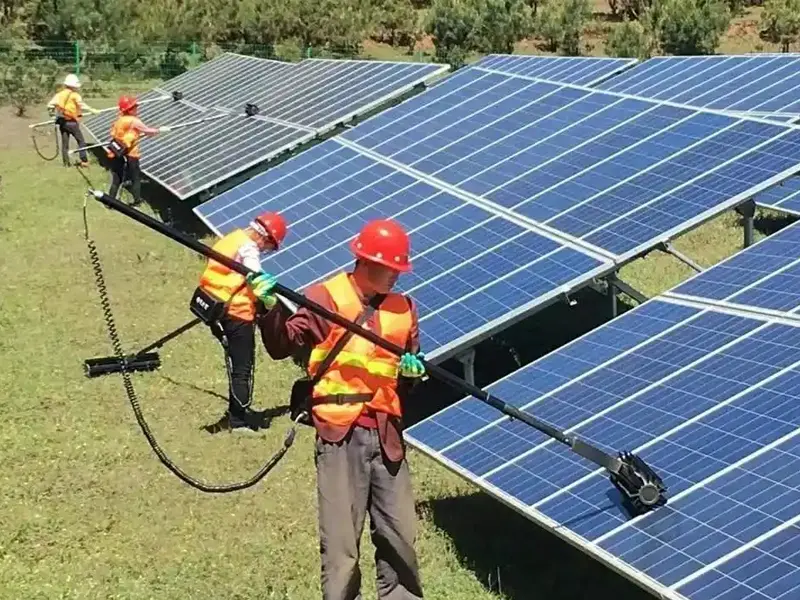
Moving Beyond Scheduled Cleaning to Condition-Based Maintenance
Relying on traditional calendar-based cleaning schedules is an outdated approach that ignores weather volatility and localized environmental shifts. If an unexpected dust storm hits a week after a scheduled clean, the plant will suffer massive losses for months before the next round. Conversely, an unexpected rainy season might clean the panels for free, making a scheduled manual wash a complete waste of capital.
Real-time PV module soiling loss monitoring shifts the paradigm to Condition-Based Maintenance (CBM). O&M teams clean the modules only when the data shows that the cost of accumulated soiling losses exceeds the actual cost of a cleaning cycle.
How Soiling Data Integrates with SCADA Systems
Modern monitoring systems do not operate in a silo. By feeding real-time Soiling Ratio (SR) metrics directly into the plant’s Supervisory Control and Data Acquisition (SCADA) system, asset managers gain an aggregated view of plant health.
[Soiling Sensors] ──> [Modbus / RTU] ──> [Plant SCADA] ──> [Automated O&M Alert]
When integrated with digital twin software or advanced asset management platforms, soiling metrics adjust the expected baseline power output of the plant. This eliminates false alarms for underperformance and automates the scheduling of cleaning crews or robotic systems precisely when it makes financial sense.
Key Technologies for PV Soiling Loss Measurement
Choosing the right measurement architecture is critical for data accuracy and operational viability. There are three primary technological approaches used in the field today:
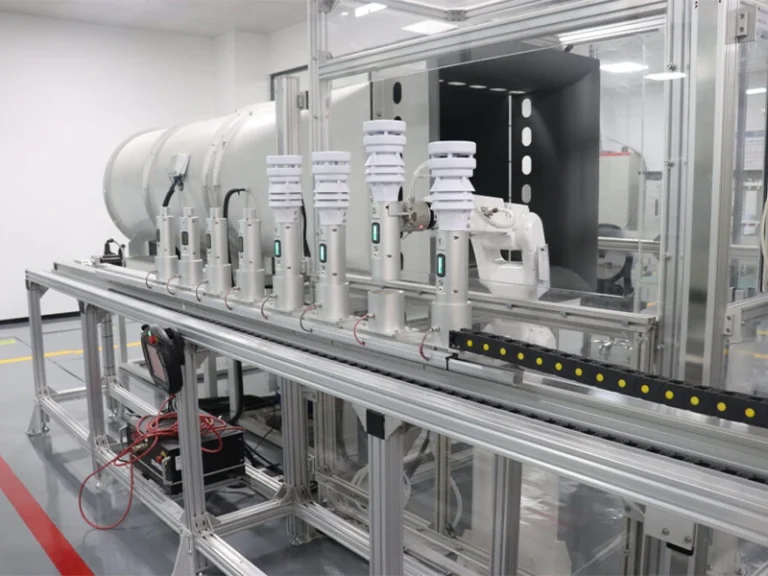
Optical Sensors (The Reference Cell Approach)
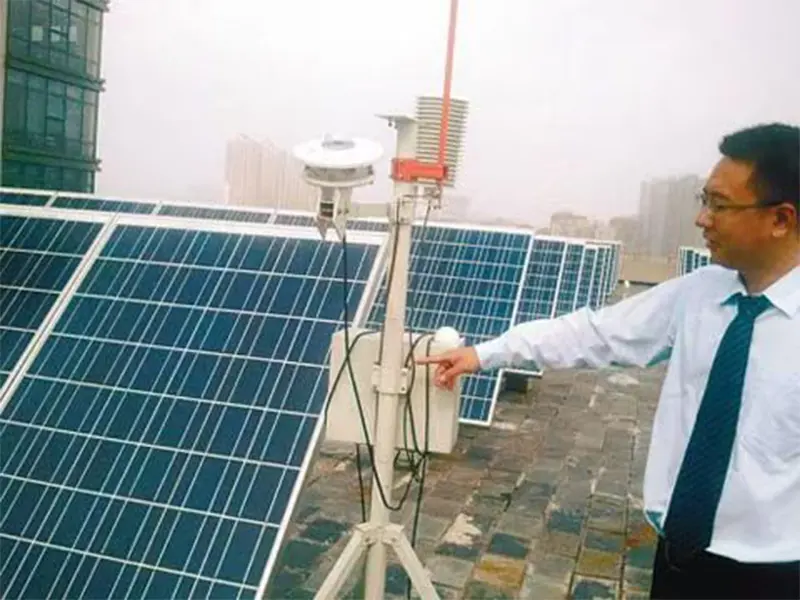
This is the gold standard for ground-level physical measurement, fully compliant with IEC 61724-1. These systems typically use two identical PV reference cells or small modules mounted at the same tilt angle as the main array.
- The Clean Cell: Kept clean continuously via an automated mechanical wiper or regular manual maintenance.
- The Soiled Cell: Left exposed to natural ambient environmental conditions.
By comparing the short-circuit current or maximum power output of the two cells under identical solar irradiance, the system delivers a highly accurate, real-time Soiling Ratio.
Soiling Monitoring Stations vs. Distributed Sensors
When deploying physical hardware, asset managers must choose between centralized and distributed topologies:
| Feature | Centralized Soiling Stations | Distributed Optical Sensors |
| Architecture | A few highly accurate, full-scale weather stations across the site. | Dozens of small, low-cost sensor nodes are attached directly to module frames. |
| Pros | High precision; robust meteorological data; easy to calibrate. | Captures micro-climate variances, localized dust patterns, and tracker-specific tracking errors. |
| Cons | Misses localized soiling variances across massive multi-kilometer sites. | Higher cumulative hardware maintenance and potential data management overhead. |
AI and Satellite-Based Soiling Estimation: Pros and Cons
With advancements in machine learning, some software platforms offer “hardware-free” soiling estimation by analyzing satellite weather data, aerosol optical depth, rainfall predictions, and inverter-level power anomalies.
- Pros: Zero upfront hardware capital expenditure (CapEx); rapid deployment across existing portfolios.
- Cons: Estimates lack the localized, real-time accuracy required for high-stakes tracking. Ground-level anomalies like localized bird nesting, nearby construction dust, or agricultural tilling cannot be accurately modeled from space.
How to Calculate PV Soiling Loss (The Metrics That Matter)
To implement a data-driven strategy, you must understand how raw sensor values translate into actionable financial decisions.
Understanding the Soiling Ratio (SR) and Soiling Rate
While the Soiling Ratio (SR) gives you a snapshot of current degradation, the Soiling Rate tells you the speed of accumulation.
If a plant has a daily soiling rate of 0.2%, it will lose approximately 6% of its generation capacity over a 30-day dry period. Monitoring the rate allows asset managers to forecast exactly when the plant will hit critical threshold limits, moving maintenance from reactive to predictive.
Environmental Factors: Rainfall, Wind, and Local Topography
Soiling calculation models must factor in localized environmental behaviors:
Topography: Portions of a solar plant located near unpaved roads, agricultural fields, or industrial cooling towers will experience radically accelerated soiling rates compared to sections further away.
Choosing the Right Soiling Monitoring System for Your Project
There is no one-size-fits-all solution; technology selection depends heavily on the scale and architecture of your solar asset.
                  ┌── Utility-Scale (10MW+) ──> Centralized Stations + Distributed Nodes
                  │
Project Scale ────┼── C&I Rooftops ───────────> Compact Optical Sensors / AI Software
                  │
                  └── Residential ────────────> AI Software Estimates (No Hardware)
Utility-Scale Solar Power Plants vs. Commercial & Industrial (C&I) Roofs
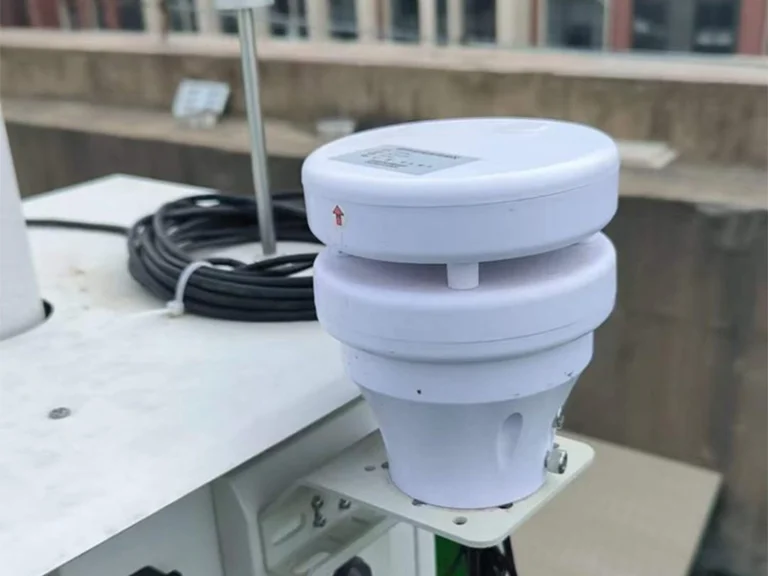
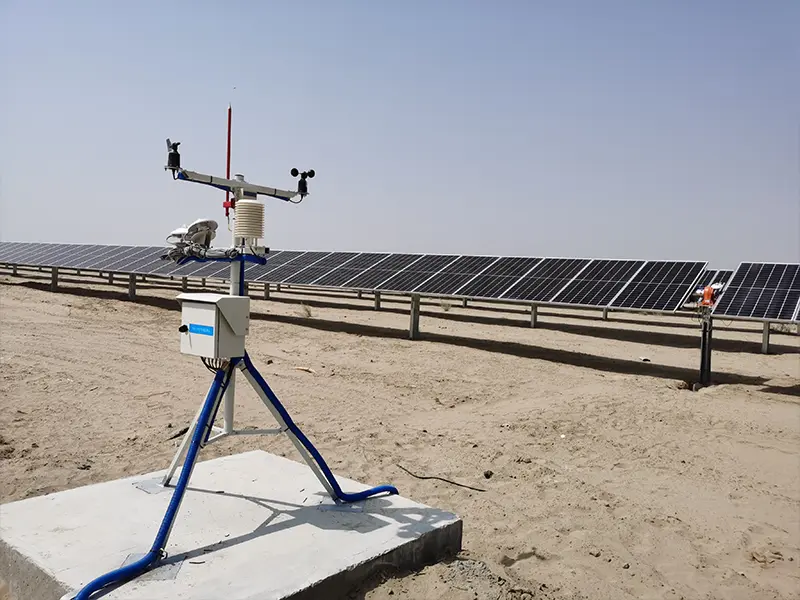
- Utility-Scale Assets: Spread across hundreds of acres, these projects require a hybrid approach: a central meteorological station equipped with premium optical sensors, supplemented by distributed wireless nodes to map soiling gradients across the entire property.
- C&I Rooftop Arrays: Space is limited, and access can be challenging. For rooftop applications, compact, low-maintenance optical sensors with automated self-cleaning wipers are ideal, eliminating the need for O&M staff to scale roofs just to clean a sensor.
Maintenance and Calibration Requirements for Soiling Sensors
A monitoring system is only as good as its data integrity. If your “clean reference cell” is allowed to get dirty due to a failed wiper or neglected manual maintenance, your entire dataset becomes useless. When evaluating hardware, ensure your O&M contract accounts for:
- Weekly or bi-weekly validation of the sensor’s clean element.
- Annual sensor calibration against NIST-traceable pyranometers.
- Robust anti-soiling coatings on the sensor housing itself.
Calculating the ROI of Implementing a Soiling Monitoring System
Investing in PV module soiling loss monitoring hardware requires internal CapEx approval. Here is how to build the financial case based on real-world asset management metrics.
Optimizing the Cleaning Schedule for Maximum Financial Return
The absolute financial sweet spot for cleaning occurs when the marginal cost of the energy being lost to dust equals the marginal cost of executing a clean.
Let’s look at a typical business case comparison:
| Metric | Traditional Fixed Schedule | Data-Driven (With Soiling Monitoring) |
| Cleaning Trigger | Every 90 Days (Fixed) | The cumulative loss is greater than or equal to the cleaning cost |
| Annual Cleaning Frequency | 4 Times / Year | 2 Times / Year (Optimized around seasons) |
| Average Annual Soiling Loss | 6.5% | 3.8% |
| Annual OpEx (Cleaning Cost) | $40,000 | $20,000 |
| Recovered Energy Value | Baseline | +$35,000 in added revenue |
Case Study: How Smart Monitoring Saved 5% in Annual Energy Losses
On a 50 MW tracking array in western Texas, an asset management firm deployed a distributed network of five optical soiling monitoring stations. Historically, the plant cleaned the modules twice a year (Spring and Autumn).
The newly installed sensors revealed that agricultural tilling from adjacent farms in mid-summer caused a localized, sudden 8% efficiency drop over just four days. Guided by this real-time data, the team authorized an emergency localized cleaning. By breaking away from their rigid calendar schedule and targeting only the impacted blocks, the plant recovered 5% in annual energy generation losses, achieving complete payback on their monitoring hardware investment within the first seven months.
Conclusión
Ultimately, balancing maximum energy yield with controlled operational costs requires moving beyond reactive, calendar-based cleaning and embracing precision PV module soiling loss monitoring. By integrating real-time, data-driven insights into your O&M workflow, you eliminate the blind spots of dirt accumulation, ensure every cleaning intervention yields a positive financial return, and secure the long-term profitability and asset value of your solar investments.
Whether you’re managing commercial rooftops or megawatt-scale utility-scale portfolios, feel free to contact our technical team at any time for a customized solution to monitor power loss due to soiling on your solar panels.