Solar Farm Performance Optimization starts with a common challenge: a solar farm generates less electricity than expected, even when its modules and inverters appear to be working normally. Changes in irradiance, module temperature, dust accumulation, weather, equipment conditions, and grid limitations can all affect energy production. Yet, inverter data alone rarely explains why performance has declined.
Effective Solar Farm Monitoring combines environmental measurements, equipment data, and historical records to identify performance gaps and guide maintenance decisions. This article explores what data to collect, how to evaluate PV performance, detect potential faults, improve maintenance, and choose the right monitoring system for more informed solar farm operation.
What Data Should Be Collected for Solar Farm Performance Optimization?
Effective Solar Farm Performance Optimization requires more than tracking electricity output. Operators need to combine environmental measurements, equipment operating data, and grid information to understand what affects energy production. The following data categories provide a practical starting point for a solar farm monitoring plan.
Recommended Data Collection Overview
| Data category | Key parameters | Propósito principal |
|---|---|---|
| Radiación solar | GHI, POA | Evaluate available solar irradiance |
| PV equipment | Module temperature, DC voltage and current | Assess PV generation performance |
| Weather | Ambient temperature, humidity, wind, rainfall | Monitor environmental conditions |
| Inverter and grid | AC power, efficiency, operating status, grid conditions | Identify conversion and grid-related issues |
| Suciedad | Dust Index, Soiling Ratio | Assess dust accumulation and potential soiling losses |
Solar Irradiance Data
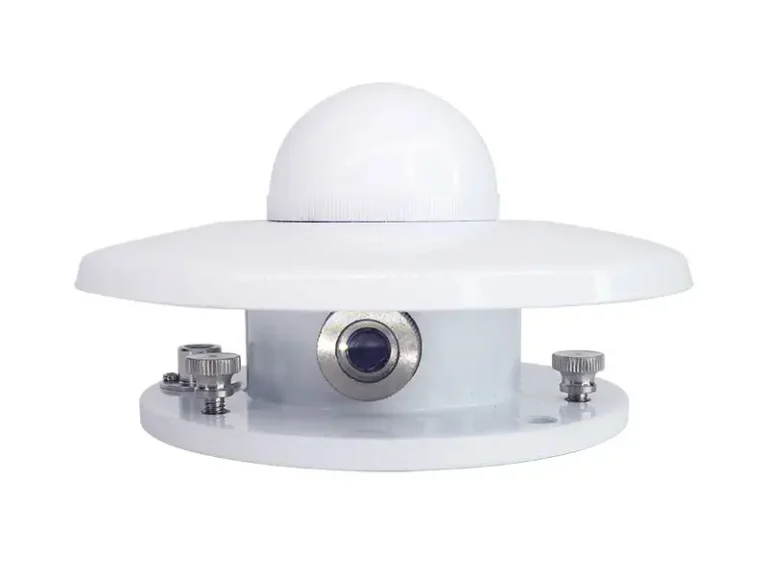
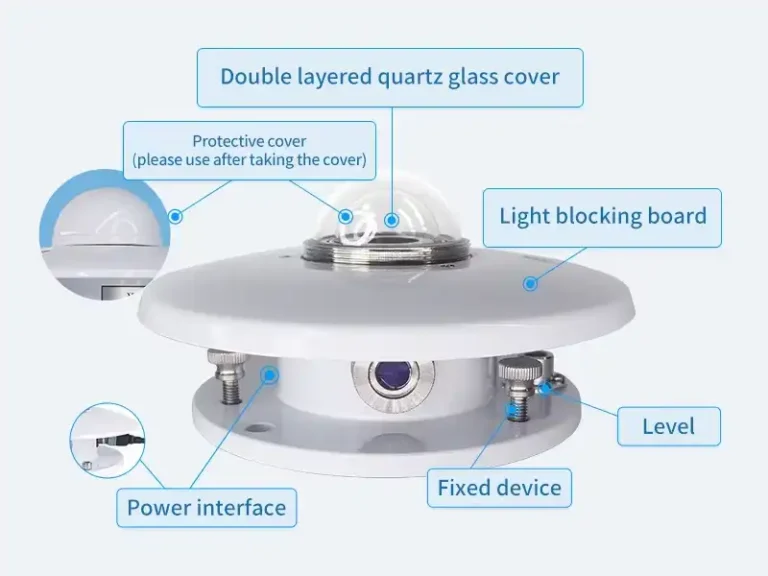
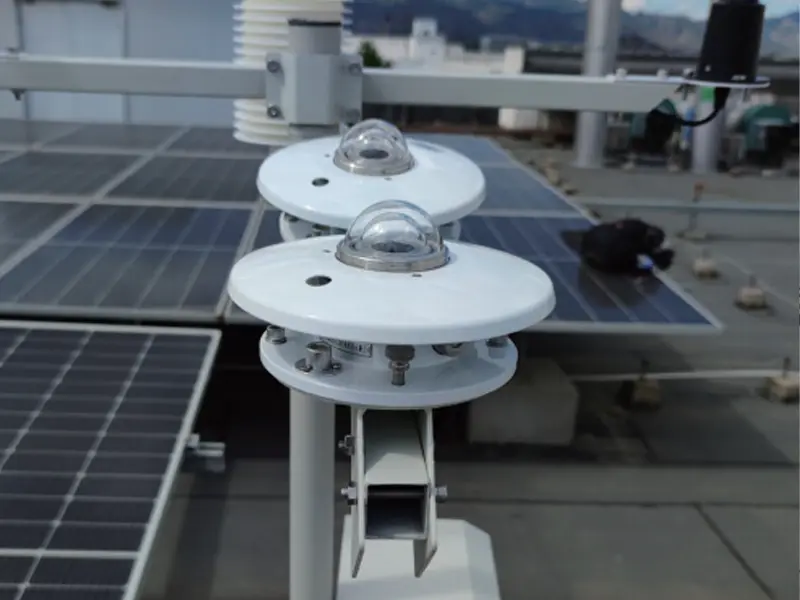
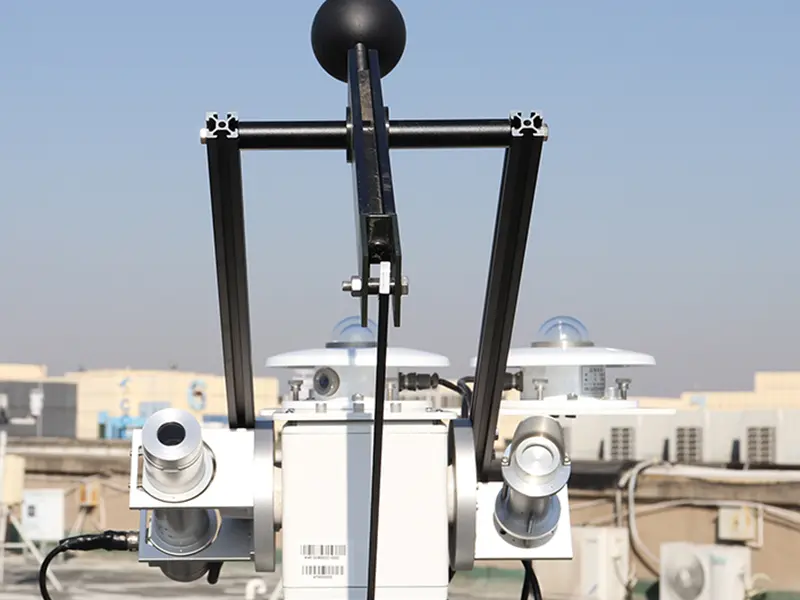
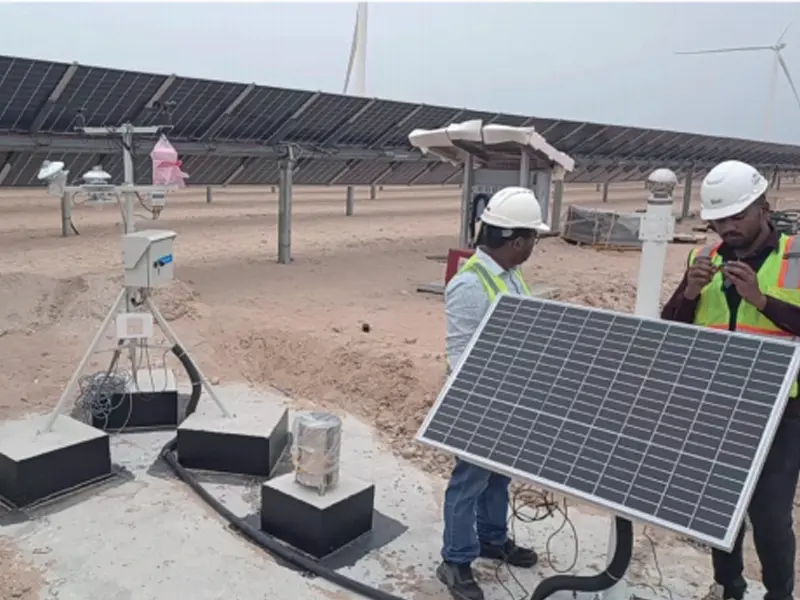
Solar irradiance is a key reference for evaluating PV energy production. Two common measurements are Global Horizontal Irradiance (GHI) and Plane of Array (POA) irradiance. GHI measures radiation on a horizontal surface, while POA measures radiation on the same plane as the PV modules. A pyranometer is used to monitor these values, with sensor orientation selected according to the monitoring objective.
PV Module and Inverter Operating Data
Key measurements include PV module temperature, DC voltage, DC current, and power. Inverter data adds AC output power, conversion efficiency, operating status, and availability. Comparing these values across strings and inverters helps identify abnormal differences and assess equipment performance. These measurements should be analyzed alongside irradiance data to distinguish environmental changes from possible equipment issues.
Weather and Environmental Data
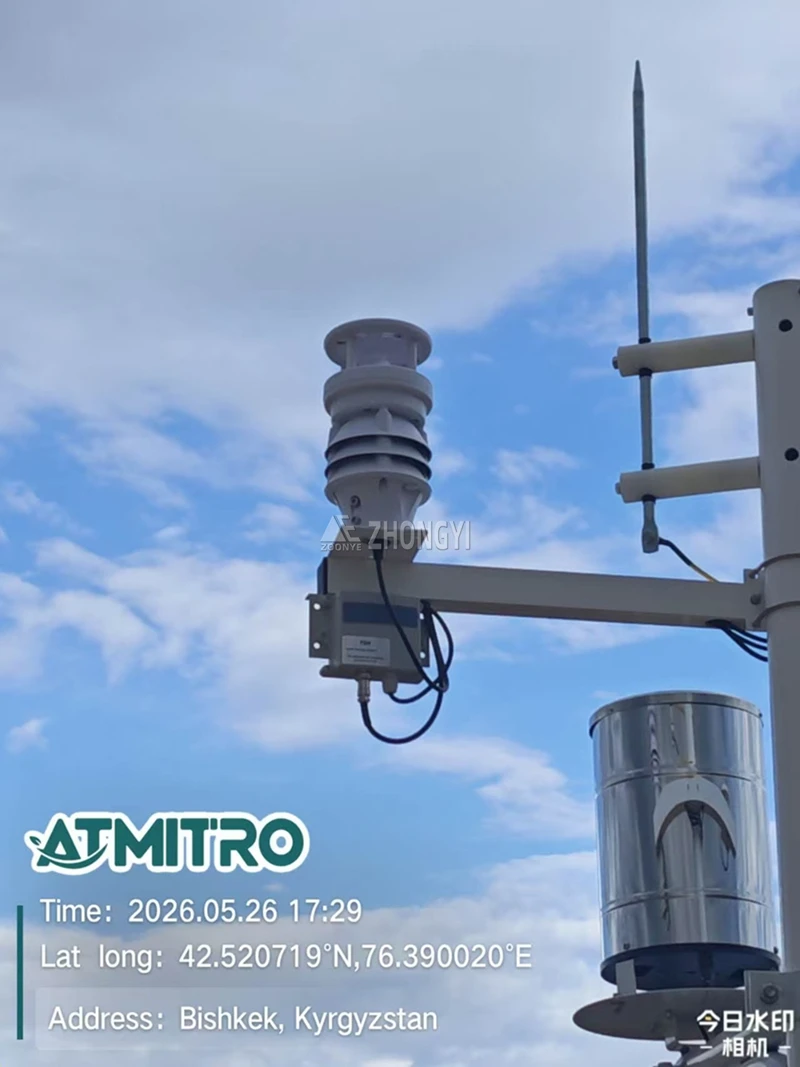
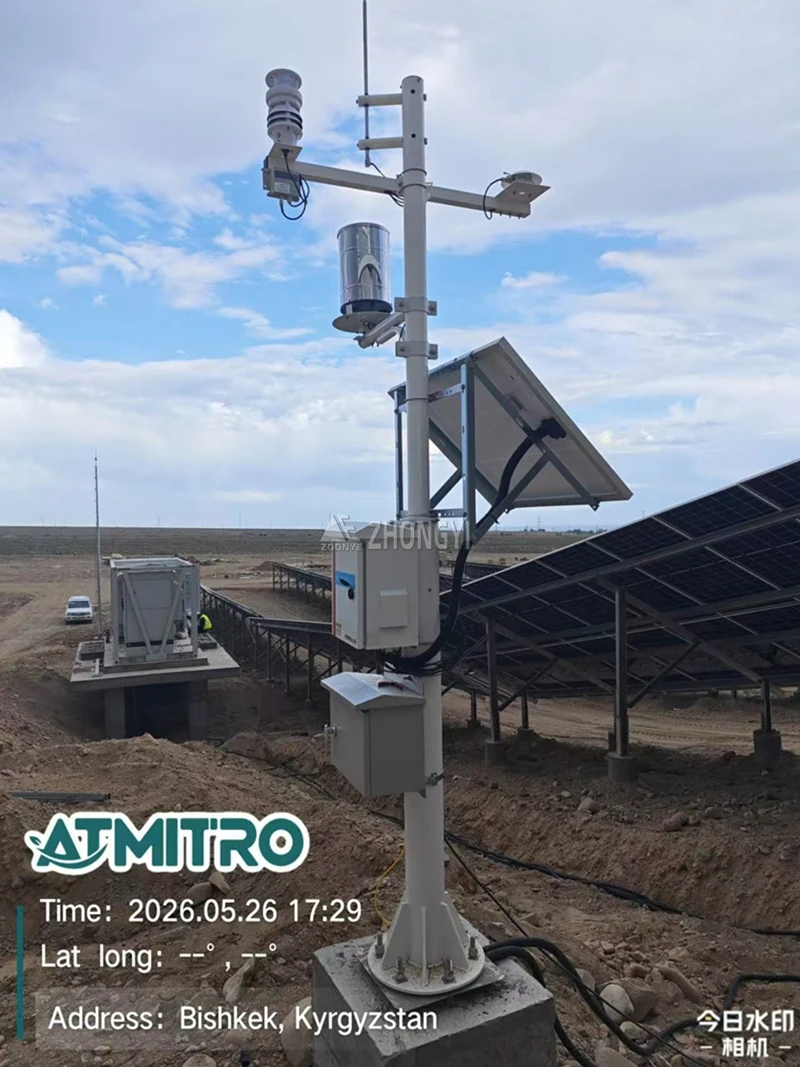
A solar weather monitoring setup may include ambient temperature, relative humidity, wind speed and direction, rainfall, and atmospheric pressure. These parameters help assess module cooling, weather-related operating risks, and changes in site conditions. Rainfall records can also support decisions about when to inspect or clean PV modules.
Soiling and Dust Monitoring Data
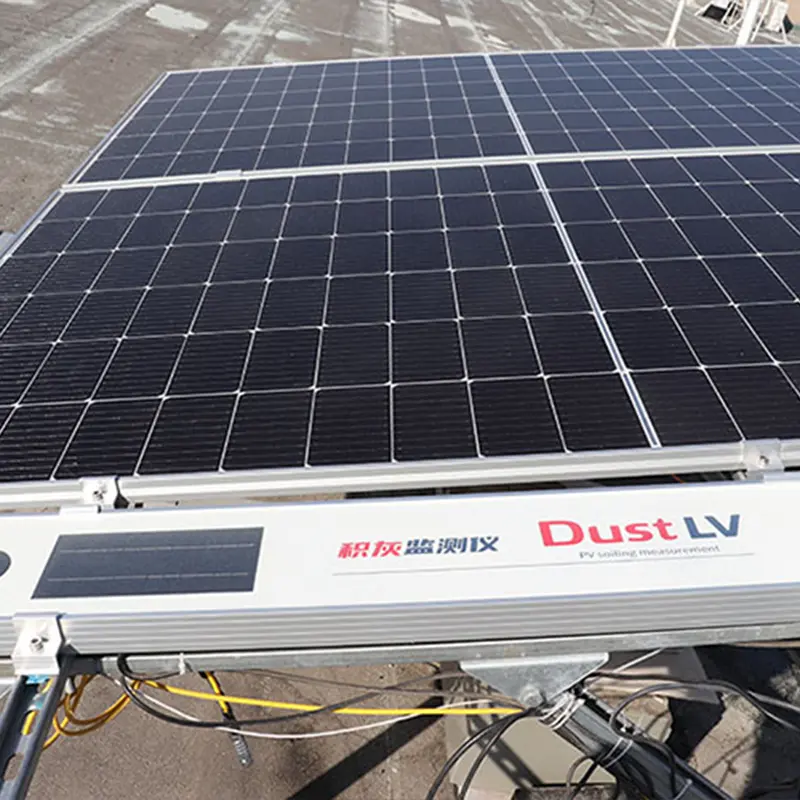
Dust, sand, and other deposits reduce the sunlight reaching PV cells. Indicators such as a Dust Index or Soiling Ratio help track accumulation and assess potential soiling losses. For a more accurate evaluation, these readings should be compared with reference or cleaned modules, as a dust index alone does not represent actual energy loss.
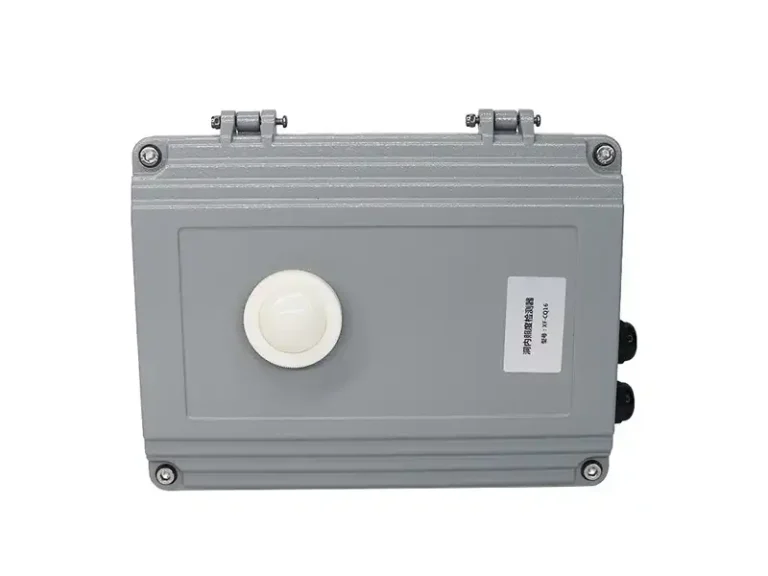
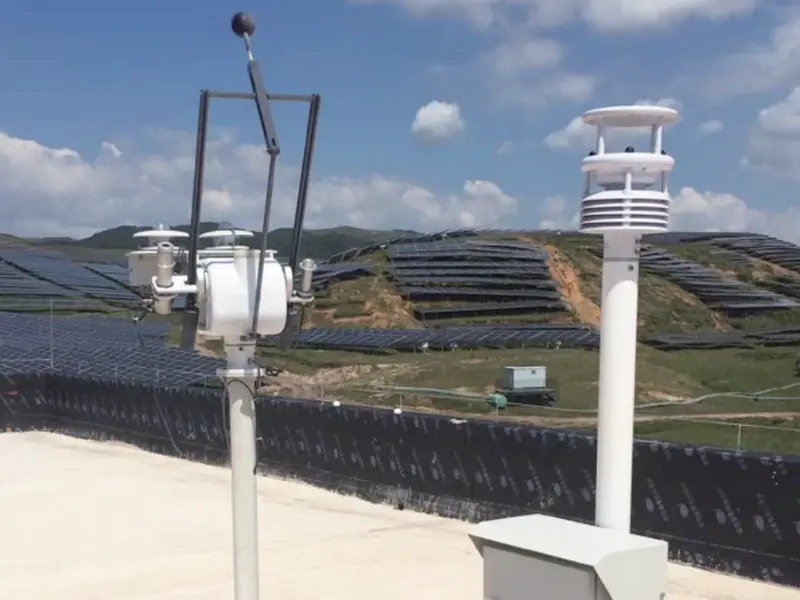
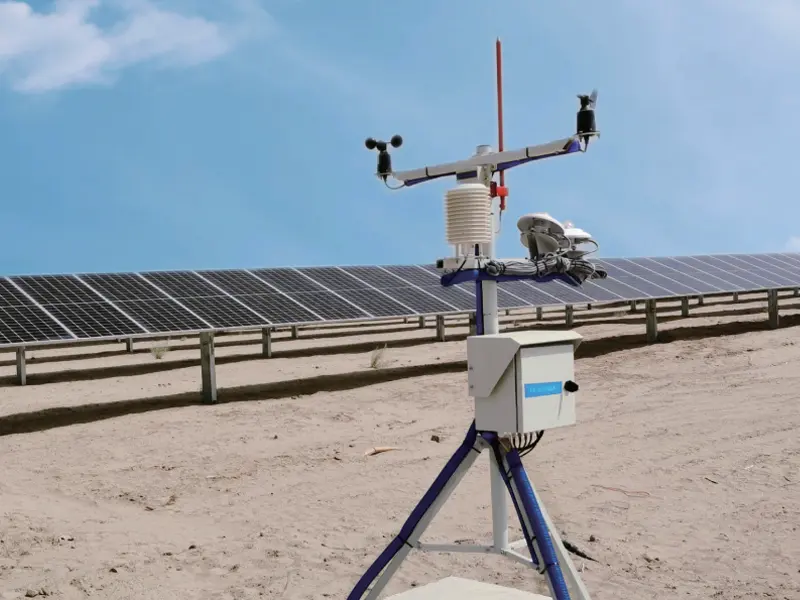
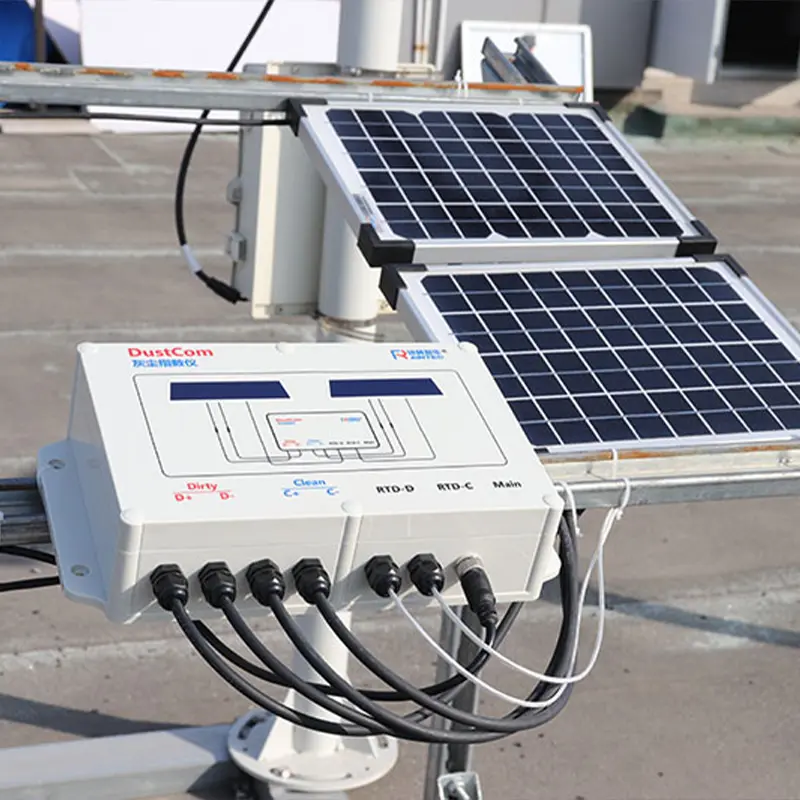
A suitable Solar Monitoring System can combine pyranometers, PV weather stations, and dust monitoring equipment. For example, Yantai Sensor offers the TBQ-2C pyranometer and PolvoCom PV dust monitoring device for relevant measurement needs. The final configuration should match the site’s layout, climate, module type, and monitoring objectives.
How to Analyze Solar Farm Performance Using Data?
Monitoring point planning is discussed in Monitoreo ambiental para granjas solares a escala de servicios públicos.
Collecting monitoring data is only the first step. When a solar farm produces less electricity than expected, operators need to determine whether the change is caused by weather conditions, operating events, measurement errors, or equipment problems. Comparing irradiance, weather, inverter, and string data helps identify the cause more accurately than looking at generation figures alone.
| Analysis step | Key data | What to look for |
|---|---|---|
| Data quality check | POA irradiance, module temperature, timestamps, maintenance records | Missing readings, sensor errors, and abnormal operating periods |
| Plant performance comparison | PR, Specific Energy Yield, historical generation | Performance changes under comparable operating conditions |
| Equipment comparison | Inverter AC output, DC input, string current and voltage | Differences between similar inverters and PV strings |
| Field verification | Sensor condition, I-V curve, infrared inspection | Whether suspected problems are related to measurement errors or equipment faults |
First, check whether monitoring records are complete and reliable. Cleaning activities, grid curtailment, scheduled maintenance, and equipment shutdowns should be recorded so that temporary operating events are not mistaken for actual performance losses. Sensor condition also needs attention. For example, dust accumulation on a pyranometer can cause it to report lower irradiance than the PV modules actually receive, making the calculated Performance Ratio (PR) appear artificially high.
Next, compare current performance with historical records and similar inverters operating under comparable conditions. PR helps evaluate overall plant performance, while Specific Energy Yield supports comparisons between systems with different installed capacities. If several inverters show a similar decline, investigate shared factors such as irradiance conditions, soiling, or grid restrictions. If the difference is concentrated in one inverter, examine its DC input, AC output, operating records, and connected strings.For the calculation reference, see Sandia National Laboratories’ Performance Ratio guide.
String current and voltage differences can help narrow down the affected circuits, but they do not confirm a fault on their own. Technicians may need to use I-V curve tracing or infrared thermography to inspect the affected strings and modules. Comparing monitoring data before and after cleaning or maintenance can also help determine whether the work has addressed the identified performance issue.


How Do Environmental Factors Affect Solar Farm Performance?
Environmental conditions influence PV power generation throughout the day and across seasons. Changes in sunlight, module temperature, dust accumulation, and weather can all affect energy output. Monitoring these conditions helps operators distinguish environmental effects from potential equipment problems.
The main environmental factors to consider include:
- Solar Irradiance and Cloud Cover: Changes in POA Irradiance affect the solar energy received by PV modules. Comparing irradiance readings with inverter power trends helps determine whether short-term generation fluctuations are related to changing sunlight.
- Module Temperature and Wind Speed: High PV module temperatures generally reduce crystalline silicon module output. Wind helps dissipate heat, while ambient temperature alone cannot represent actual module operating temperature. Monitoring both temperature and wind speed provides a clearer picture of thermal conditions.
- Dust Accumulation and Soiling Loss: Dust, sand, and other deposits reduce the sunlight reaching PV cells. Dust Index readings, rainfall records, and generation trends can help assess soiling conditions and determine whether further inspection or cleaning is needed.
- Rainfall and Humidity: Rainfall may remove some surface deposits, but light rain does not always restore module cleanliness. Humidity and moisture exposure also provide useful information when evaluating local environmental conditions and potential equipment risks.
For example, when generation declines, operators can compare POA Irradiance, module temperature, Dust Index, rainfall, and inverter output. If the power reduction coincides with lower irradiance or increasing soiling readings, environmental conditions may explain part of the change. If the measurements do not account for the decline, equipment inspection should follow.
How Can Solar Data Analytics Detect Equipment Anomalies?
Solar Data Analytics helps identify abnormal equipment behavior by tracking changes in electrical measurements and operating records.
PV Module and String Abnormalities
Unusually low string current or voltage differences between similar PV strings may indicate shading, disconnected circuits, module mismatch, or connection problems. These readings help narrow down the circuits requiring inspection.
Inverter Performance Abnormalities
Changes in DC input, AC output, operating temperature, frequent shutdowns, or declining availability may indicate inverter problems. Grid curtailment and operating limitations should be ruled out before identifying equipment faults.
Common Anomaly Detection Methods
- Threshold Monitoring: Flags measurements outside predefined operating limits.
- Historical Data Analysis: Identifies persistent deviations from normal operating patterns.
- Machine Learning: Detects complex patterns when sufficient reliable historical data is available.
Data analytics identifies potential abnormalities, not confirmed faults. Technicians may need I-V curve tracing, infrared thermography, or electrical inspections to verify the cause.
How to Use Monitoring Data to Improve Solar Farm Maintenance?
Monitoring data helps O&M teams organize maintenance tasks according to site conditions, operating requirements, and available resources. Key applications include:
- Inspection and Repair Planning: Use confirmed maintenance findings to prepare work orders, assign technicians, and arrange spare parts. Group tasks by equipment location to reduce repeated site visits.
- Solar Panel Cleaning Optimization: Combine Dust Index readings, rainfall records, and cleaning costs to determine suitable cleaning intervals instead of following a fixed schedule.
- Maintenance Scheduling: Use weather forecasts and expected generation patterns to arrange non-urgent maintenance during suitable working conditions and lower-generation periods.
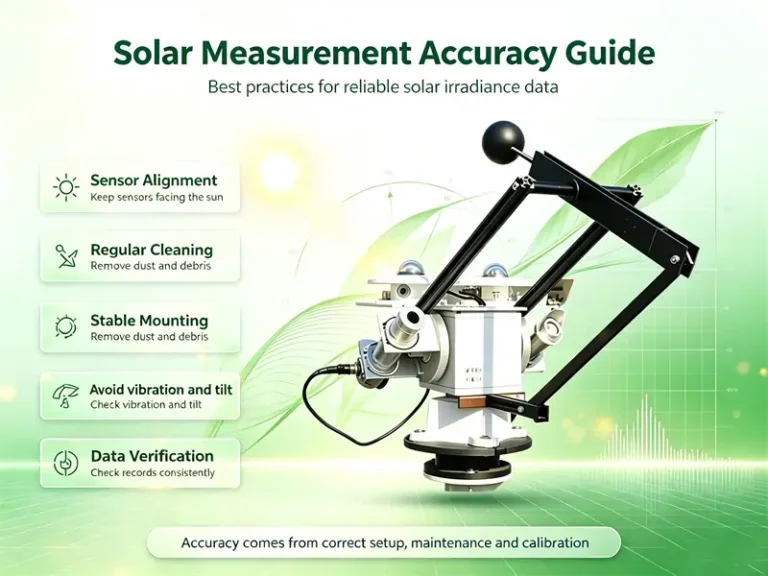
- Monitoring Sensor Maintenance: Include pyranometer cleaning, sensor positioning checks, and periodic calibration in routine O&M plans to maintain reliable measurements.
How to Integrate Multiple Data Sources for Long-Term Optimization?
Routine instrument checks are covered in How to Maintain Solar Monitoring Systems?.
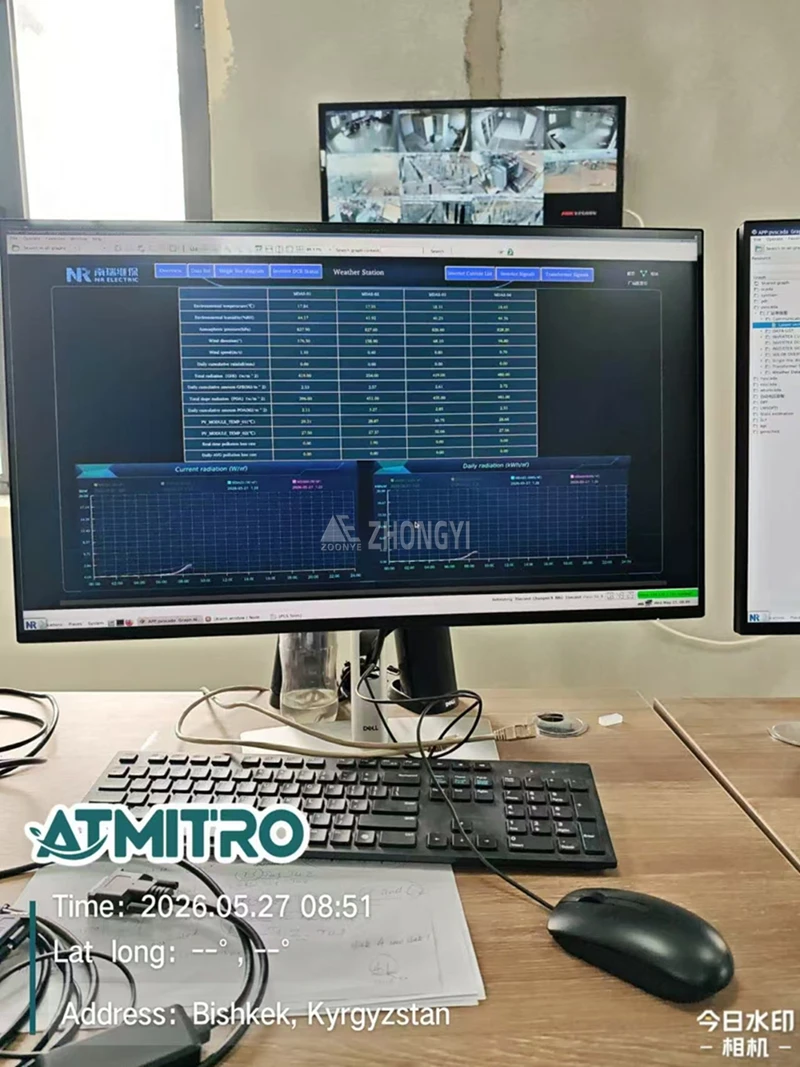
Long-term Solar Farm Performance Optimization requires data from different systems to be organized into a consistent record. SCADA and inverter data, solar radiation measurements, weather station readings, soiling records, maintenance logs, and grid operation data should share consistent timestamps, units, and equipment identifiers. Recording data sources, measurement locations, and missing values also helps maintain traceability and reliable Solar Data Analytics.
Over time, Historical Solar Performance Data can reveal seasonal generation patterns, gradual equipment degradation, and recurring operational changes. Comparing records across different seasons and years helps operators distinguish normal seasonal variations from longer-term performance changes. These records can also support equipment replacement decisions, adjustments to monitoring point placement, and planning for future PV projects as part of Solar Asset Management.
How to Select Monitoring Equipment for Solar Farm Performance Optimization?
Selecting the right monitoring equipment requires more than comparing product specifications. The equipment should match the project’s measurement requirements, site conditions, and existing data acquisition setup. A suitable configuration also helps maintain consistent measurements throughout long-term solar farm operation.
Match Equipment to Project Requirements
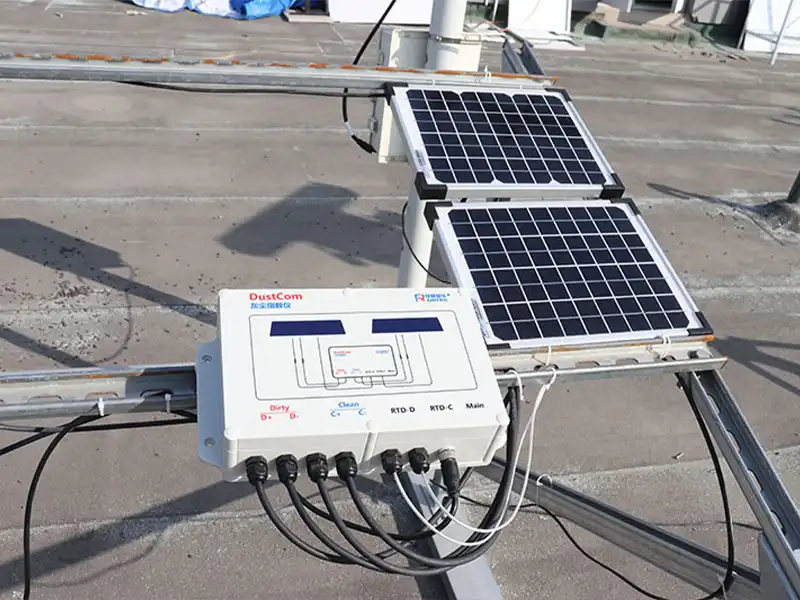
Start by identifying the measurements required at each monitoring location. A pyranometer can be selected for solar irradiance measurements, while a multi-parameter PV weather station is suitable when several environmental conditions need to be monitored together. If dust accumulation is a concern, a dedicated PV dust monitor can provide additional soiling information. Yantai Sensor offers the TBQ-2C pyranometer, XF700SL solar radiation monitoring station, and DustCom PV dust monitoring system for these different measurement needs.
Evaluate Specifications and Site Compatibility
Compare measurement range, accuracy specifications, operating temperature, protection rating, and installation requirements. Site conditions also matter. Sensor orientation, mounting position, shading, exposure to rain and dust, and maintenance access can all affect measurement reliability. For example, a pyranometer should be installed with the correct orientation and kept clean to maintain dependable irradiance readings.
Check Communication and Manufacturer Support
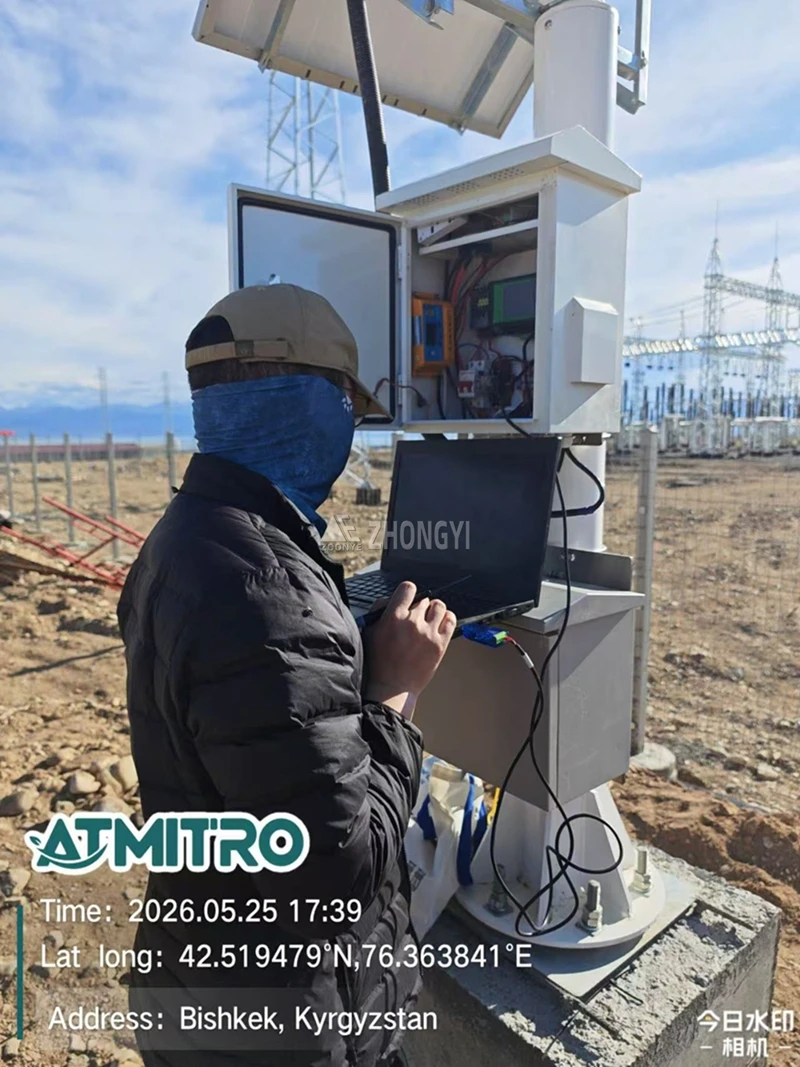
Before purchasing, confirm that sensor interfaces and communication protocols are compatible with the project’s data logger or existing monitoring platform. RS485, Modbus RTU, and SDI-12 may be relevant options, depending on the selected model. It is also useful to work with a manufacturer that can provide clear technical specifications and discuss product configuration, wiring, and installation requirements. Yantai Sensor’s R&D and manufacturing capabilities support project-specific discussions when selecting solar monitoring sensors.
Conclusión
Before field deployment, use the Guía de instalación de monitoreo fotovoltaico to review mounting, wiring and commissioning requirements.Effective Solar Farm Performance Optimization depends on reliable field measurements, not just electricity generation records. Irradiance, module temperature, weather conditions, soiling, and equipment operating data need to be evaluated together to identify performance losses and understand their causes. With suitable Solar Monitoring Sensors and consistent Solar Performance Analysis, operators can make better-informed decisions about equipment inspection, cleaning, and maintenance.
Yantai Sensor provides solar radiation sensors, PV weather stations, and soiling monitoring equipment to support reliable data collection for photovoltaic performance monitoring. Our team can help review project requirements and select suitable monitoring configurations based on site conditions and operational needs. Contacte a Yantai Sensor to discuss your solar monitoring requirements and find suitable equipment for your project.